
Founder’s Note: Sam Gatlin, like all of us at TrendLabs, loves history. And he really appreciates a nice cultural reference from the past.
Take today’s headline, a great starting point many of us will enjoy at multiple levels.
And then there’s the fascinating data from more than a century ago that’s valuable right now… – JC
By Sam Gatlin
One of the most important technical analysis books I ever read was Steve Nison’s “Japanese Candlestick Charting Techniques.”
I read it in college, and it completely changed the way I looked at markets.
Nison helped me understand that every candle tells a story about the battle between buyers and sellers.
That’s what makes candlestick analysis so powerful.
These tools didn’t come from Wall Street, a quant desk, or a modern trading platform.
They came from Japanese rice traders hundreds of years ago, long before Bloomberg terminals or online brokerages.
Munehisa Homma, the legendary Japanese rice trader from the 1700s, is often credited as one of the pioneers of this work.
He studied price, supply, demand, weather, psychology, and the behavior of other traders.
And while many things have changed over the centuries, the human behavior behind price hasn’t.
That’s why these old tools still matter.
The Hammer
One of my favorite candlestick patterns is the hammer.
A hammer forms after a decline, when sellers drive price sharply lower during the period, only for buyers to step in and push price back near the highs by the close.
Visually, it looks like a small body near the top of the range with a long lower shadow beneath it.
That lower shadow is the story.
It shows the sellers had their chance.
They pushed price lower and appeared to be in control.
Then buyers showed up and squeezed ‘em.
And that’s why it’s called a hammer.
Buyers are hammering out a bottom.
Not every hammer works…
Nothing in markets works every time.
But when I see a hammer form on a higher timeframe, especially after a sharp decline and near an important level, I lean forward in my chair and pay attention.
Because price may be saying something before the headlines.
The Hammer That Mattered
Last Friday, JC hosted a TrendLabs Lab Training session, Here’s How We Profit From History.
He walked through previous stock market cycles, and one chart stood out to me more than any other: the Dow Jones Industrial Average in the early 1900s.
In November 1907, after a brutal decline, the Dow formed a beautiful hammer candle on the monthly chart.
That candle marked a major low.
From that November 1907 hammer low, the Dow rallied roughly 90% into its October 1909 peak.
That alone is impressive.
But the more important lesson came years later.
When World War I broke out in 1914, the New York Stock Exchange closed for months.
Europe was falling apart.
Investors were terrified.
Nobody knew how bad the war would get or what the financial system would look like when trading resumed.
When the market reopened, stocks got hit hard.
And where did the decline stop?
Right back near the 1907 hammer low:
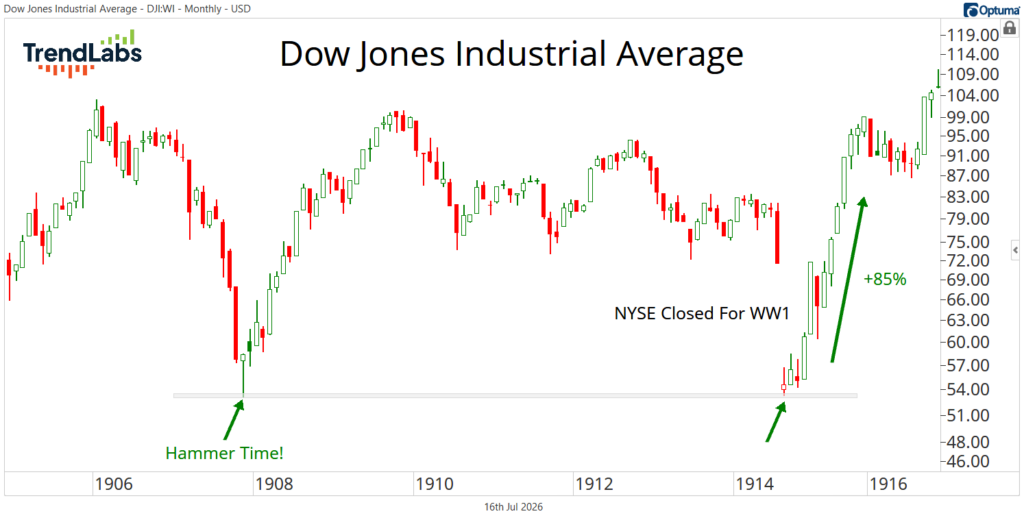
The 1907 hammer wasn’t just a cute candle pattern with a funny name.
It marked a point at which buyers overwhelmed sellers amid a panic.
Years later, during another panic, that same level mattered again.
The market came back to the scene of the prior battle, tested support, and held.
Then the Dow rallied roughly 85% into late 1915.
World War I was raging.
The headlines were horrific.
And fundamental investors had every reason to be scared.
But price was telling a different story.
Price Remembers
This is what people misunderstand about technical analysis.
They think we’re just drawing lines.
They think candlesticks are little shapes with clever names.
But this is real information.
The 1907 hammer showed buyers stepping in during panic.
And the 1914 retest showed that support still mattered.
That’s why studying history is such an advantage.
The market environment will always change, but human psychology will never change.
That’s the lesson I took from Nison’s book.
It’s also the lesson I took from JC’s Lab session.
The goal is not to predict the future with certainty.
The goal is to study the evidence, understand where buyers and sellers are fighting, and recognize when price is saying something different from the prevailing narrative.
One day, we’ll see another moment like this.
The headlines will be scary.
People will say the world is ending.
Everyone will have a reason to panic.
And maybe they’ll be right.
But before I believe them, I’m still going to look at price.
Because price has been recording the same battle for hundreds of years.
Everybody’s wrong about Japanese candlesticks.
Stay safe out there,
Sam Gatlin
Analyst, TrendLabs