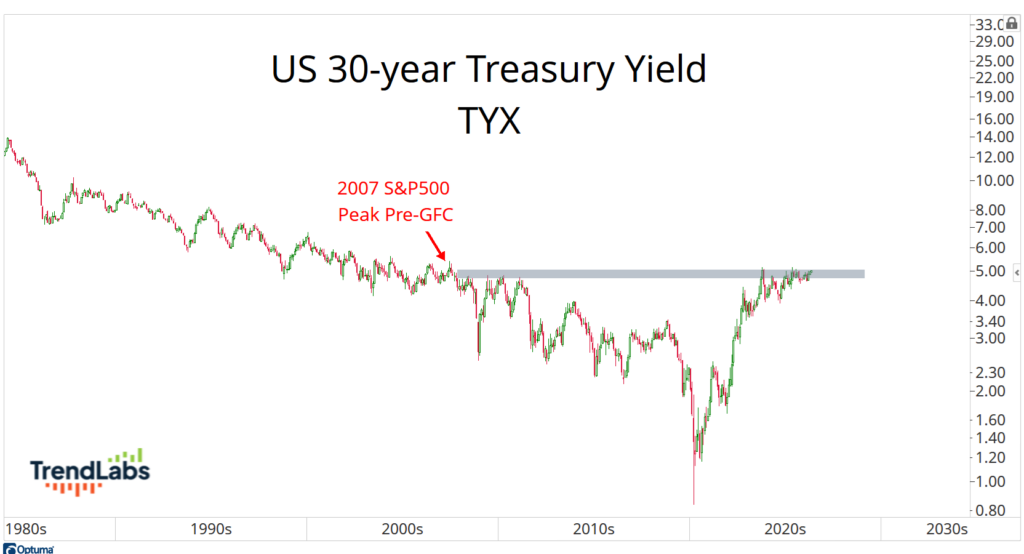
Long-term interest rates are back to where they were just before the 2007 peak that led into the Great Financial Crisis.
The yield on the 30-year Treasury bond is now above 5% and knocking on the door of fresh 18-year highs:
Let that sink in.
At the same time, bonds are stuck in one of the longest drawdowns we’ve ever seen.
The Bloomberg U.S. Aggregate Bond Index has been going nowhere for years, and the longer-term data going back to the 1970s says we’ve never seen a stretch like this.
While everybody debates what the Fed might do next, the bond market has already made up its mind.
And that’s really the point.
This isn’t a story about what policymakers say. It’s about what prices are doing.
Because if there’s one thing we’ve learned over the years, it’s that the bond market tends to be right. And when it disagrees with the narrative, it usually wins.
That’s where we are right now.
So let’s take a look at what the bond market is actually doing and why it matters.
We’re going to look at how rates behaved the moment the Fed started cutting, and what this setup in bonds is telling us.
If we’re right about this storm, it won’t just be bonds moving.
I definitely expect this “bond tsunami” to spill into other assets once it arrives.
The Market Already Voted
Remember, interest rates stopped falling the moment the Fed started cutting.
Yes, you read that right.
In September 2024, the Fed began its latest rate-cutting cycle. They control the federal funds rate. That’s their tool.
The rates that matter to us, mortgages and the 10-year, are driven by the market.
And those had been trending lower for a full year after peaking in 2023.
Then the Fed stepped in.
And that’s exactly when yields bottomed:
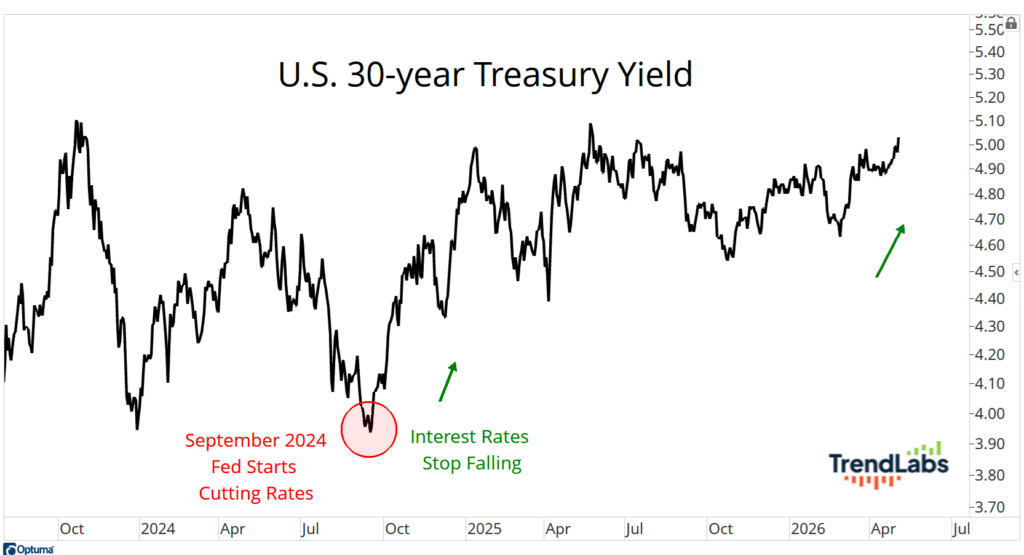
From that point forward, rates across the curve turned higher. Not eventually. Immediately.
That’s not coincidence. That’s a divergence between what people think is happening vs what is actually happening.
That’s the bond market telling you it sees something very different than policymakers.
And when you get that kind of disagreement, history is pretty clear about who tends to win.
Compression Leads to Expansion
If you know bonds, you know the game.
Nothing happens…nothing happens… nothing happens… then everything happens at once.
Over the past few years, the 10-year and 30-year yields have been stuck in wide but well-defined ranges near multi-decade highs.
A lot of movement inside the range, but no real resolution:
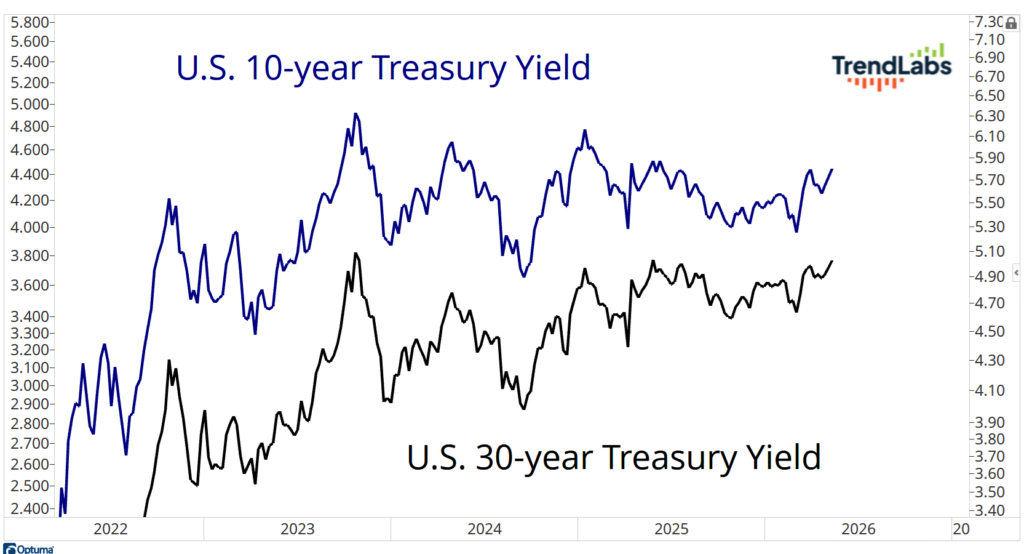
To most people, this just looks like noise. It’s not. It’s pressure building.
Volatility in rates has been getting squeezed. Tighter ranges, failed breakouts, no follow through.
That kind of environment doesn’t stick around.
Volatility mean-reverts. Compression leads to expansion.
And when that expansion shows up in rates, it doesn’t stay there.
Stocks feel it. Commodities react. Currencies move. Everything is tied to this.
Right now, equities are benefiting from a bond market that’s elevated but still behaving, still contained.
When that changes, everything changes.
Because when this breaks, it won’t be subtle. There will be a lot of confusion – and huge winners.
I’ll be right here, showing you exactly how we’re positioned, what we’re buying, and how we’re managing risk.
It might feel uncomfortable for some.
But for those who are ready, this is where the big money gets made.
Stay sharp,
JC Parets, CMT
Founder, TrendLabs