
There’s something happening in semiconductor stocks right now that reminds me an awful lot of what we saw back in 2000.
If you’ve been around long enough, you probably remember how that turned out.
Now, before anybody gets carried away, I’m not suggesting we’re about to see another dot-com crash.
In fact, I think the odds favor the exact opposite outcome.
But there’s a reason we study history. And there’s a reason I spend so much time looking at old charts.
Human behavior doesn’t change very much. The companies change. The technology changes.
The people buying and selling the stocks change. But the emotions behind those decisions?
Not so much.
Every once in a while, we see something in today’s market that looks eerily similar to something we’ve seen before.
This is one of those times.
Take a look at this chart of semiconductor stocks:
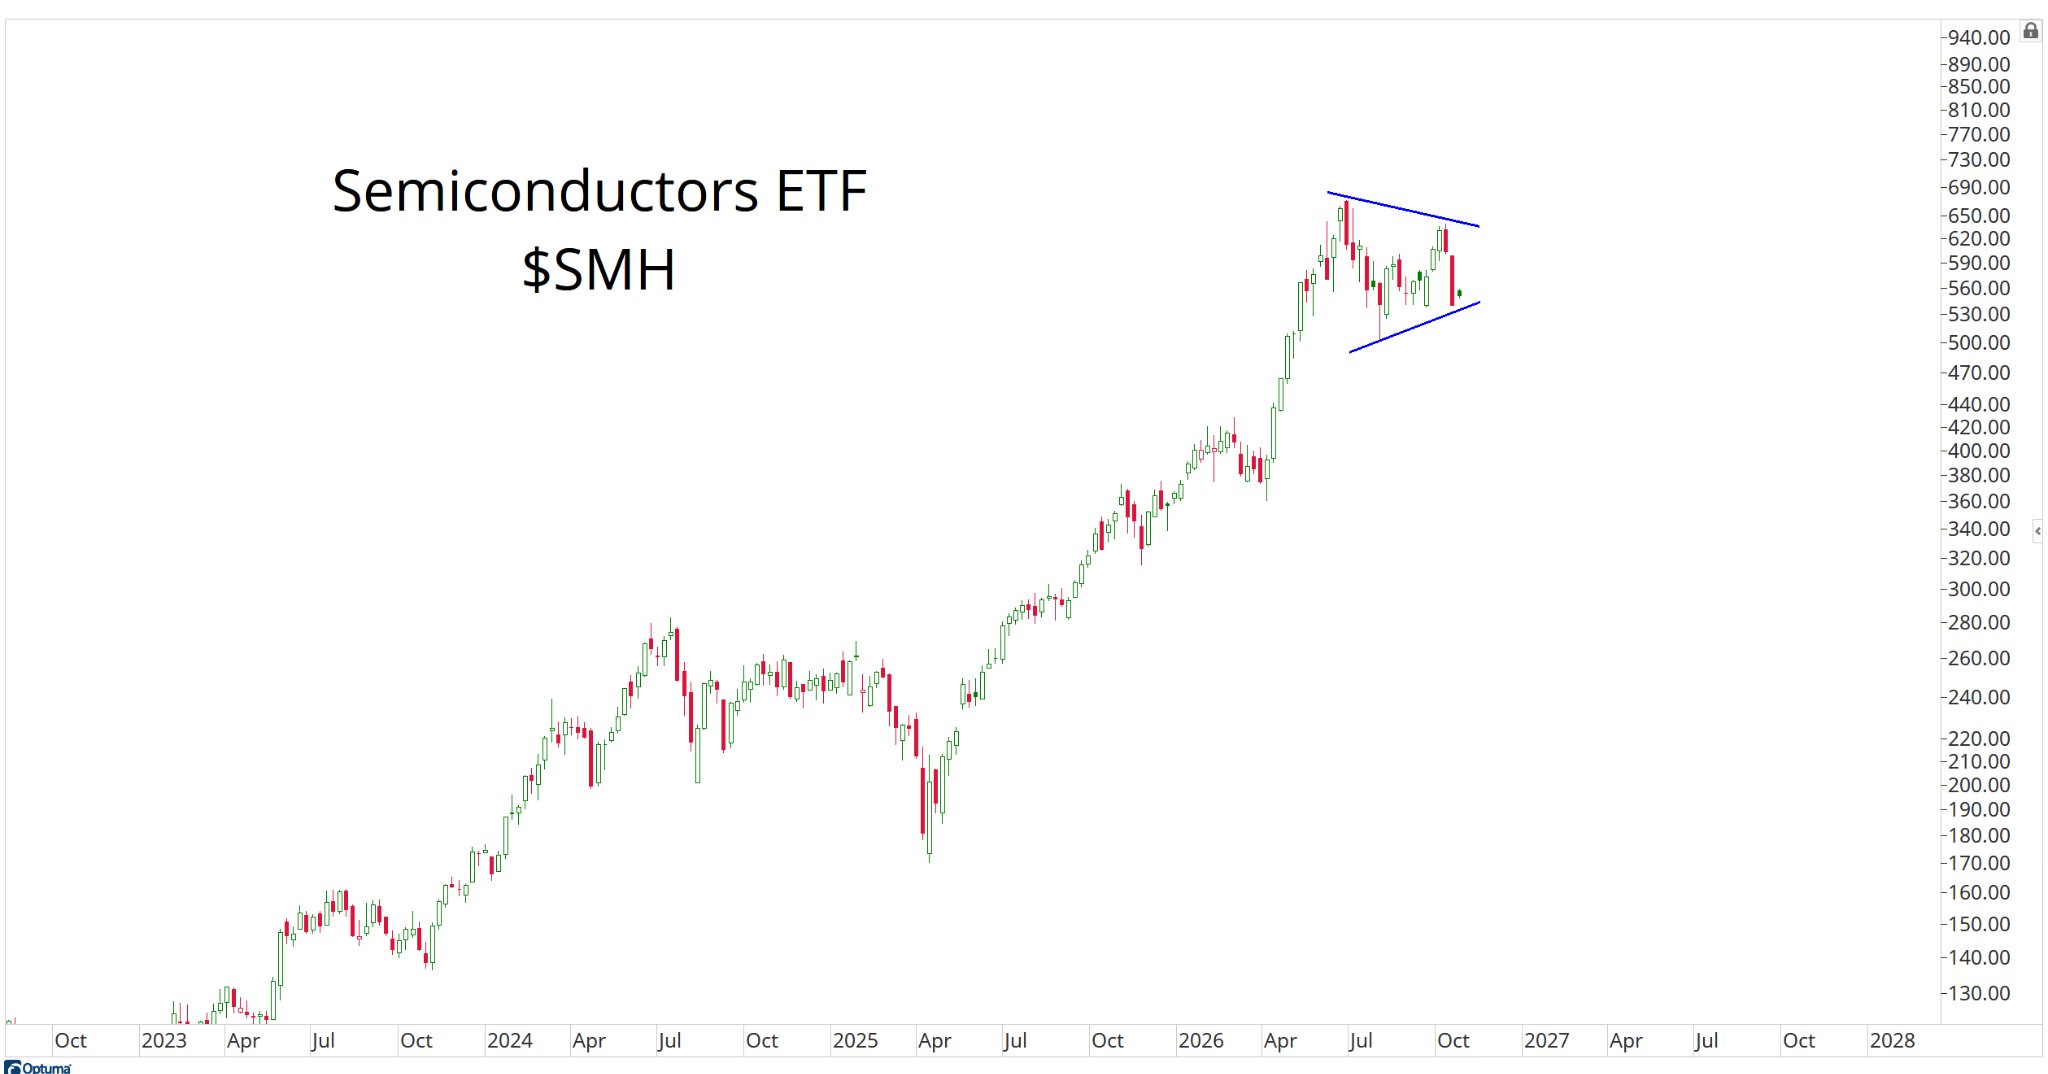
These are the companies that make the computer chips powering everything from your iPhone to artificial intelligence.
Notice how aggressively these stocks have been climbing over the past several years.
That’s a beautiful uptrend.
Now, after that enormous run, prices have stopped going up and have started moving sideways.
We call that “consolidation.”
Think of consolidation like a runner taking a break during a long race.
The runner hasn’t turned around and started running backward. They’re just catching their breath before continuing in the same direction.
That’s what we generally expect from stocks when they consolidate during an uptrend.
They take a break, shake out some of the weaker investors, and eventually continue higher.
But what happens when they don’t?
We’ve Seen This Movie Before
About three weeks ago, I was giving a presentation in New York City when I pulled up a chart of semiconductor stocks from the late 1990s.
I wanted to show the audience something that I had been thinking about.
Back then, semiconductor stocks were in an incredibly powerful uptrend.
Investors were making a fortune, technology was changing the world, and everybody wanted a piece of the action.
Sound familiar?
Then, in late 1999 and early 2000, semiconductor stocks stopped going up and began consolidating.
The pattern looked almost exactly like the one we’re seeing today.
The difference is what happened next.
Instead of breaking out to new highs and continuing their uptrend, semiconductor stocks broke down.
That turned out to be a pretty big deal:
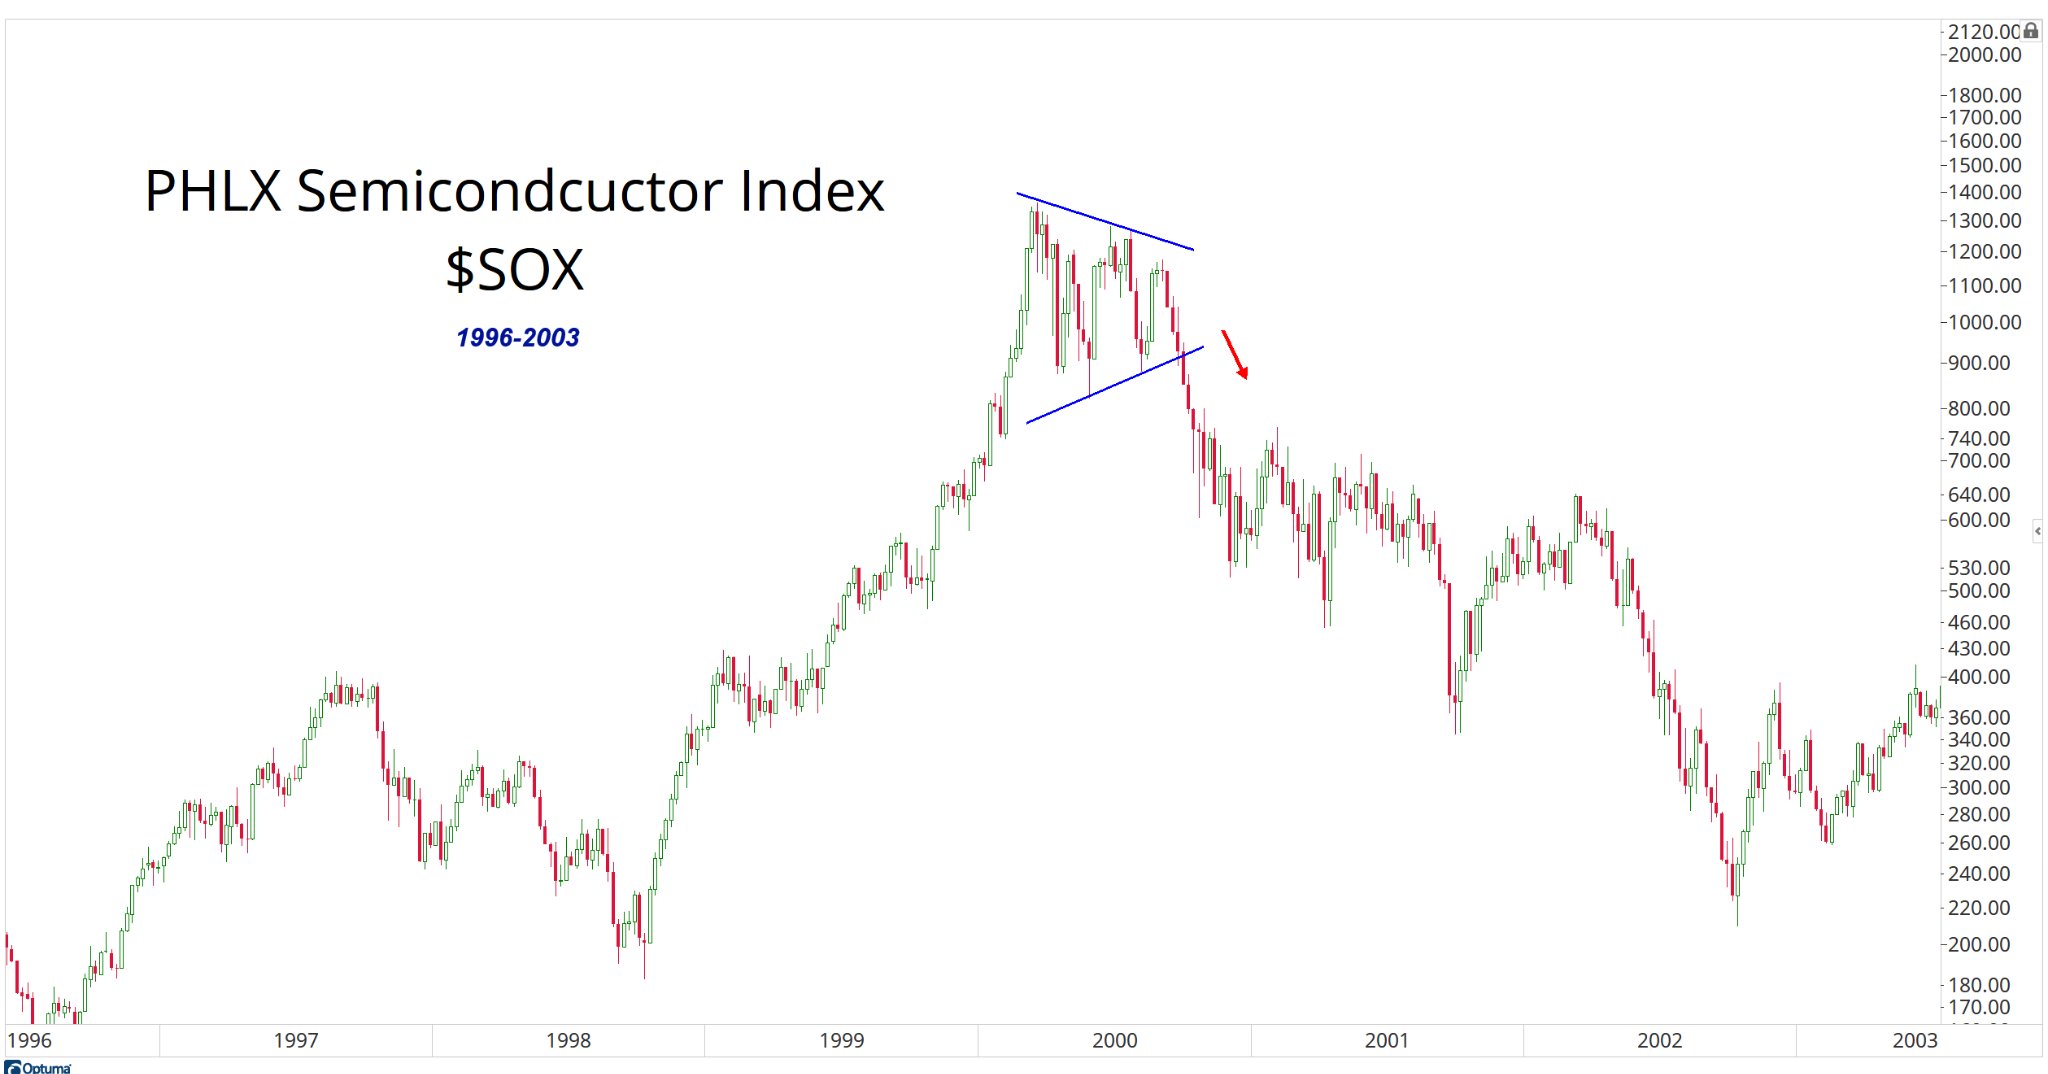
Look at that chart.
You can see the enormous rally leading into 2000, followed by that little triangle near the top.
That triangle was supposed to be a continuation pattern.
In other words, based on the direction of the trend leading into it, the higher-probability outcome was for prices to break out to the upside.
Except they didn’t.
They broke down instead, and semiconductor stocks spent the next couple of years getting absolutely destroyed.
This is one of the things I love about technical analysis.
We’re not just looking for patterns that tell us what we want to hear. We’re also looking for situations where the market does something it’s not supposed to do.
Because when a market fails to do what it should, that can tell us a lot about what’s happening underneath the surface.
Here’s the funny part.
Over the weekend, my friend Ari Wald, chief strategist at Oppenheimer, brought up this exact comparison in his weekend research note.
I started laughing when I saw it.
Ari and I were formally trained to look at markets in many of the same ways. We probably talk once every month or two, but we hadn’t discussed this at all.
And I know for a fact he wasn’t at my presentation in New York.
Yet here we are, independently looking at the same two charts and noticing the same thing.
I thought that was pretty cool.
So shoutout to Ari for bringing this up over the weekend and inspiring me to share these charts with you.
The Odds Still Favor the Bulls
I still expect semiconductor stocks to move higher.
The trend favors it, and two similar charts aren’t enough to convince me we’re headed for another 2000.
But the comparison gives us a reason to watch this group closely.
These chips power the products and businesses that investors are so excited about.
If their stocks start breaking down, that would make me question how much confidence those investors really have.
For now, I’m happy to let this play out.
There are plenty of stocks acting well where I can put money to work while semiconductors make up their minds.
I don’t need to guess which way they’ll go to find a good trade somewhere else.
A breakout would give us a reason to get more involved. A breakdown would give us a reason to be more careful.
Either way, we’ll learn something useful.
That’s what the chart from 2000 is doing for us today. It gives us something to watch, and a reason to stay flexible.
I’d rather change my mind than spend the next two years defending a bad trade.