
My friend Larry Thompson just had a baby.
And when somebody has their first kid, I’m always curious what’s going on inside their head.
I’ve had three kids. I can tell you that becoming a father changes the way you think.
Something happens chemically. Your priorities change. You notice different things. You start looking at the world through a different lens.
Mothers probably experience the same thing, but I can’t speak to that. I can tell you what happened to me as a father.
So when I was talking to Larry the other day, I wanted to take advantage of his new superpower.
What are you thinking about now?
His answer surprised me.
Phantom stats.
I love that phrase.
Larry was talking about all these numbers we use to describe what’s happening in the world that technically might be correct, but don’t necessarily tell you what’s actually happening.
The average is probably the best example.
Imagine you have one foot sitting in a bucket of ice water and the other foot sitting in boiling water.
On average, the temperature might be perfect.
But I promise you, you’re not comfortable.
The math is right.
Your feet would disagree.
The Market Has Phantom Stats, Too
We do this in markets all the time.
We say, “The S&P 500 is up 8% this year.”
OK, that does tell me something.
But it doesn’t tell me what happened to the stocks inside the S&P 500.
Maybe half the stocks are up 30% and the other half are down 14%.
Maybe one group of stocks is having its best year in a decade while another group is getting destroyed.
The average can hide all of that.
That difference between the winners and losers is what we call dispersion.
That sounds like a fancy Wall Street word, but it’s really simple.
If one kid in a classroom gets a 100 on a test and another gets a 20, there’s a big difference between their scores.
If everybody gets between an 80 and an 85, there isn’t much difference.
That difference is dispersion.
And we’ve been seeing some pretty big dispersion in the stock market throughout this year and again this quarter.
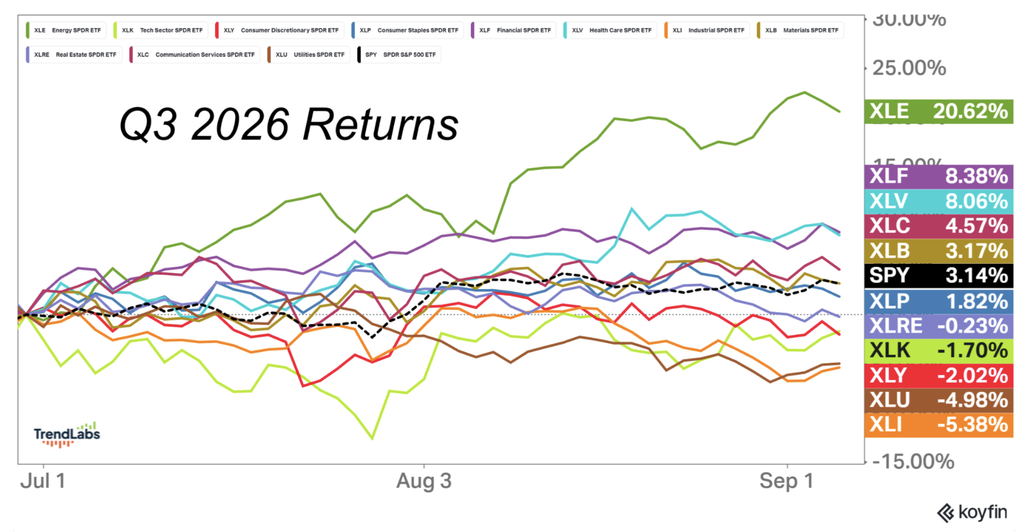
Look at that chart. This is exactly why simply knowing what “the market” is doing isn’t enough.
The average might look perfectly normal (S&P 500 +3.14%), while underneath the surface there are stocks ripping higher (energy +20.6%), stocks getting crushed, and entire groups moving in completely different directions.
That’s not a problem with the average.
We’re just asking it to tell us something it was never designed to tell us.
Look Under the Hood
This is one of the biggest lessons I’ve learned from spending my life looking at markets.
Never stop at the headline number.
If somebody tells me the S&P 500 is up, I want to know what’s happening underneath it.
Are most stocks participating? Which sectors are leading? Which ones are falling behind? Are small companies doing the same thing as the biggest companies?
And this matters even if you never trade a stock in your life.
Because you don’t own “the market.” You own the things in your portfolio.
If the S&P 500 is up 10% and your stocks are down, telling yourself “stocks are doing great” isn’t particularly useful.
And if the S&P 500 is struggling while the things you own are working, the scary headline isn’t particularly useful, either.
So what should you do about it?
Pay attention to what you actually own. Know which parts of the market are getting stronger and which are getting weaker.
And when the averages and your portfolio are telling you two different stories, don’t assume your portfolio is wrong just because the headline says otherwise.
Think about the economy. If I told you the average person in a bar was worth $100 million, you’d probably assume you wandered into a pretty fancy bar.
But if Warren Buffett happened to be sitting in the corner, everybody else could be broke.
The average would still be correct. It just wouldn’t describe the room.
Markets work the same way. Use averages. They’re incredibly useful. I use them every day. Just don’t confuse the average with reality.
Your job isn’t to invest in the average. Your job is to figure out where the strength actually is and make sure you’re participating in it.
Sometimes the most important thing happening in markets is exactly what the average is hiding.
That’s the phantom stat.
The number is real. The picture it paints might not be.
Stay sharp,
JC Parets, CMT
Founder, TrendLabs