
I was hanging out with Louise Yamada in New York City last week.
Louise is a legend in technical analysis.
She started working at Smith Barney before I was even born, and she’s been an inspiration to me and generations of market technicians.
We were talking about markets, charts, and some of the principles that have been around forever.

And it got me thinking about Bitcoin.
Because one of the funniest things about Bitcoin is that this brand-new asset keeps doing things that market technicians have been studying for generations.
Robert Edwards and John Magee published “Technical Analysis of Stock Trends” in 1948.
They were studying trends, support, resistance, and the behavior of buyers and sellers long before anyone had heard the words “Bitcoin” or “blockchain.”
These guys were drawing charts by hand.
And yet here we are, almost 80 years later, watching Bitcoin follow the same basic principles.
The First Day of Kindergarten
One of the first things you learn in technical analysis is something called polarity.
It sounds fancy. It isn’t.
A price level that used to be a ceiling can become a floor once prices finally break through it.
And a level that used to be a floor can become a ceiling after prices fall below it.
Former resistance becomes support. Former support becomes resistance.
That’s it. This isn’t magic. It’s supply and demand.
It’s human behavior.
Imagine Bitcoin keeps getting up near $20,000, and sellers keep showing up. Every time it gets there, it gets knocked back down.
That area is resistance.
Then, one day, Bitcoin finally breaks through.
Now something changes.
The people who sold near $20,000 might want another chance to buy. The people who missed the breakout might be waiting for Bitcoin to come back down.
Suddenly, the same area where there used to be too much supply can become an area where demand shows up.
The level didn’t change.
The behavior around it did.
Look at this chart:
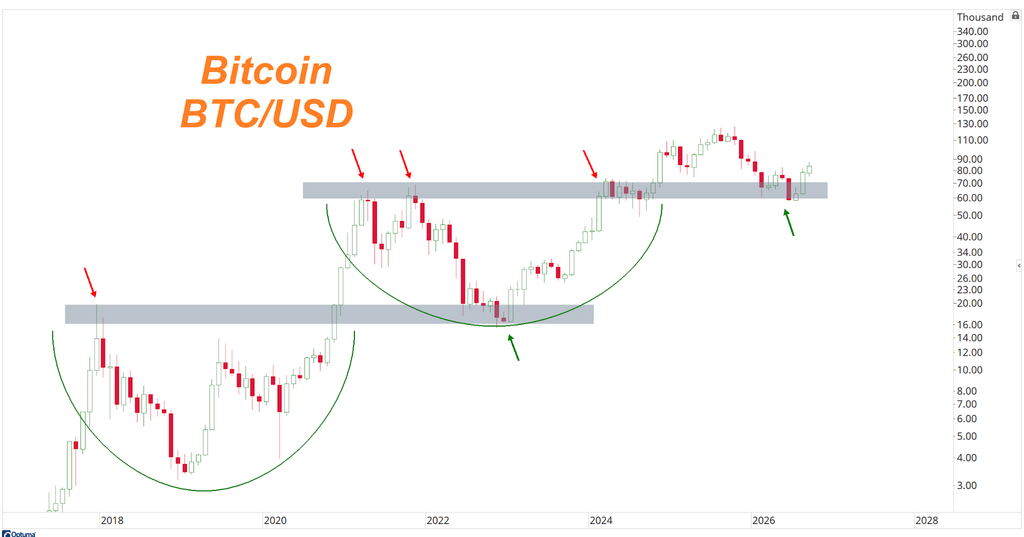
Bitcoin peaked around $20,000 at the end of 2017, then collapsed roughly 84% over the following year.
It eventually recovered, broke through those old highs and went on to another massive run.
Then Bitcoin came back down toward that old 2017 resistance area.
What happened? Buyers showed up. Former resistance became support.
Bitcoin eventually broke out again and reached nearly $69,000 in 2021.
Now look at what’s happened around those prior-cycle highs.
Same principle.
Different decade. Different price. Different group of investors.
Same humans.
Humans Haven’t Changed
That’s the part I find so fascinating.
Bitcoin didn’t exist when Edwards and Magee wrote their book. There were no crypto exchanges. There were no Bitcoin ETFs.
There wasn’t a blockchain. There wasn’t even an internet.
But there were still markets. And there were still people making decisions about what to buy, what to sell and at what price.
That part hasn’t changed.
People still chase things after they go up. They still panic when prices fall.
They still sell too early, buy too late and wish they had another chance when they miss a move.
That was true 100 years ago. And it’s true in Bitcoin today.
That’s what we’re actually looking at when we look at charts.
Human behavior.
Technology changes. Markets evolve. The products we trade certainly change.
People don’t change nearly as much.
That’s why these patterns keep showing up.
And that’s why I think this matters today.
We don’t need to predict every wiggle in Bitcoin. We don’t need to know what it’s going to do Tuesday afternoon.
The monthly chart is telling a much bigger story.
Those prior-cycle highs are important. The summer lows are important.
As long as Bitcoin continues to hold above that former resistance zone and remains above those lows, the bigger trend remains intact and the path of least resistance remains higher.
We’ve also discussed the momentum thrusts we’ve seen in Bitcoin and why those have historically mattered following major resets.
None of this means Bitcoin has to go straight up. That’s not how markets work.
It means we have a framework.
If those old highs keep acting as support, that’s information. If Bitcoin starts breaking those levels and staying below them, that’s different information.
We don’t have to guess. We can just watch how buyers and sellers behave around the levels that matter.
The asset is new. The technology is new.
The chart is telling a story that’s almost 100 years old.
Stay sharp,
JC Parets, CMT
Editor, Everybody’s Wrong