
On May 15, Jerome Powell’s final day as Fed Chair, the bond market gave him one last parting gift.
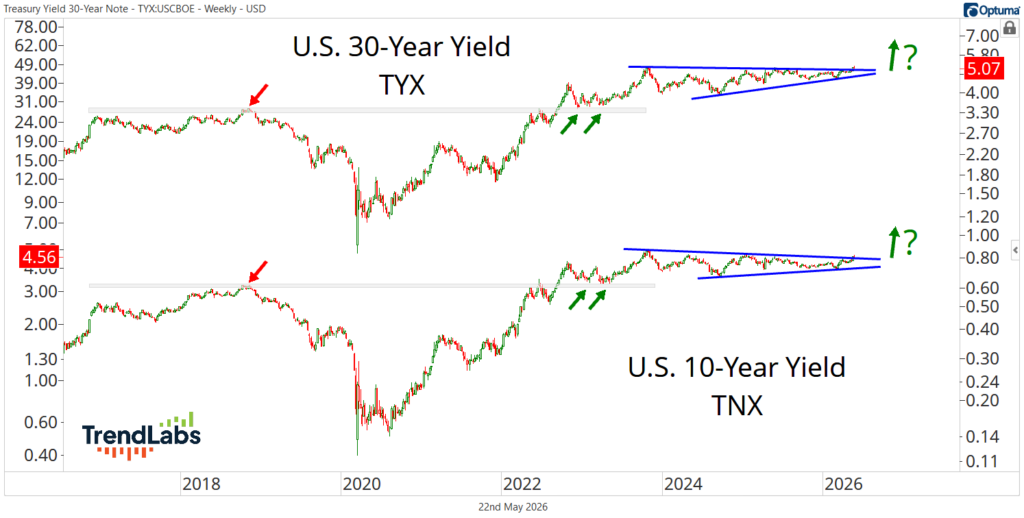
The U.S. 30-year yield closed at its highest level since 2007, finally clearing the late-2023 peak that had capped rates for years. The 10-year isn’t far behind:
That’s not the sendoff Wall Street wanted.
It’s not the “inflation is dead, rates are falling, soft landing secured” narrative market commentators have been hawking.
But the market doesn’t care what story people prefer.
Yields Are Breaking Out
What this breakout says is simple.
Policy still isn’t tight enough. Inflation risk hasn’t disappeared. The post-COVID regime is very much alive.
For decades, bonds were the cushion. Whenever stocks fell, bonds bounced. That was the deal.
Then 2022 happened…
Stocks fell. Bonds fell harder. The classic 60/40 portfolio had one of its worst years on record.
The relationship changed. Most investors still haven’t adjusted.
That’s why this breakout in yields matters – not just for bond holders, but for everyone.
You don’t need to own bonds to be exposed to the bond market.
If you own assets that depend on lower rates, cheaper money, and falling inflation, the bond market already has a hand on your portfolio.
And right now, that hand is tightening.
Energy Is the Tell
One of the clearest ways to see this regime shift is with the ratio of energy stocks to bonds.
The Energy sector (XLE) versus 20+ Year T-Bonds (TLT) has broken out to new all-time highs.
Historically, that ratio has moved closely with the U.S. 30-year yield.
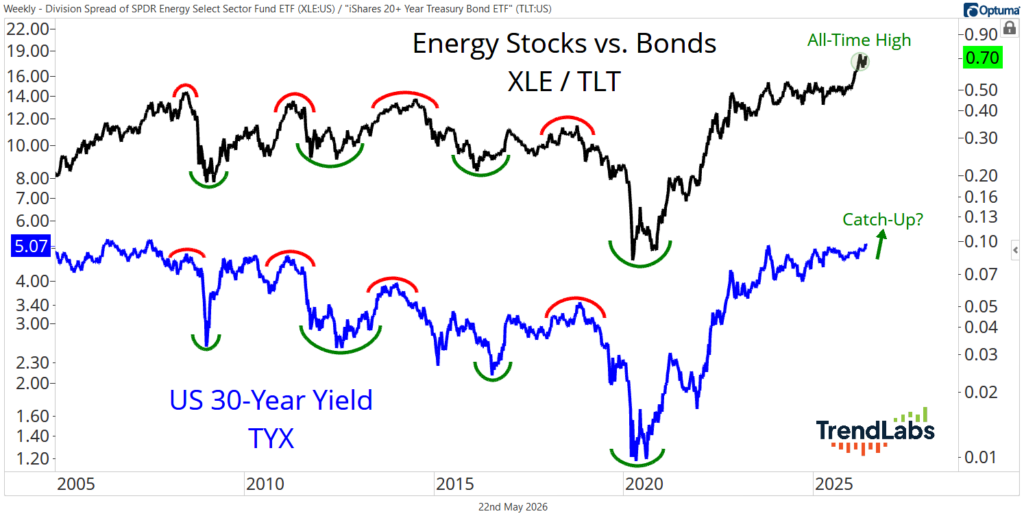
When energy stocks outperform long bonds, capital is moving toward real assets, inflationary cash flows, and companies tied to the physical economy. Away from duration.
At the same time, it’s moving away from duration in the bond market.
If this relationship holds, buying energy stocks may remain one of the best ways to express a bearish view on bonds – without touching the bond market at all.
The Drillers Are Waking Up
That brings us to one of the strongest corners of the energy market right now: North American onshore drillers.
There isn’t a clean index for this group, so we built our own basket–
Equal-weighted across names like Helmerich & Payne (HP), Patterson-UTI, Nabors (PTEN), Precision Drilling (PDS), and a handful of others.
The result is one of the best-looking charts in the energy space.
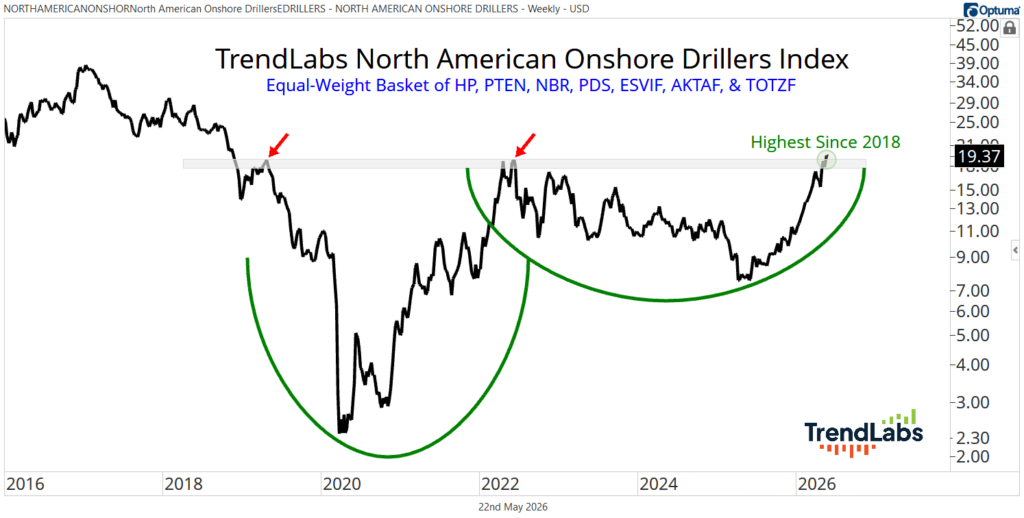
After a brutal bear market, the group rallied 700% off the 2020 lows, then spent the next several years building another large base.
Now it’s breaking out again, closing this week at its highest level since 2018.
That’s exactly what you want to see from a cyclical group transitioning into a new primary uptrend.
Most investors still think inflation was a temporary problem that came and went.
The bond market, energy stocks, and global yields disagree.
If long-term rates continue breaking higher, the consequences won’t stay confined to bond portfolios.
They’ll show up in mortgage rates, credit costs, equity valuations, and the affordability crisis already squeezing households across the country.
Inflation doesn’t need to look like 2022 to create problems.
It just needs to stay sticky enough to keep rates higher than investors, consumers, and policymakers are prepared for.
That’s how the market tightens for the Fed.
Powell may be walking out the door, but the bond market is not done talking.
If you want to watch our full Bond Tsunami Lab session and see how we’re positioning for this environment in real time, become a TrendLabs member today.
Stay sharp,
JC Parets, CMT
Founder, TrendLabs