
Founder’s Note: If you’re worried or anxious about the market right now, Grant Hawkridge has what you need.
If you’re preparing to look for opportunities right now, our man Down Under has what you need.
What we do is all about data. And here’s a good look at what some important pieces of it are telling us about what comes next. – JC
In my last breadth note, I was looking for more stocks to join the advance.
On Wednesday, they did.
The NYSE Composite and the Nasdaq Composite both gained about 1.5%, and most issues went up on both exchanges.
That’s what I like to see on a good day. When an index rises, I want to know how many stocks helped it get there.
By Thursday’s close, both indexes had given back all of Wednesday’s gains and then some:
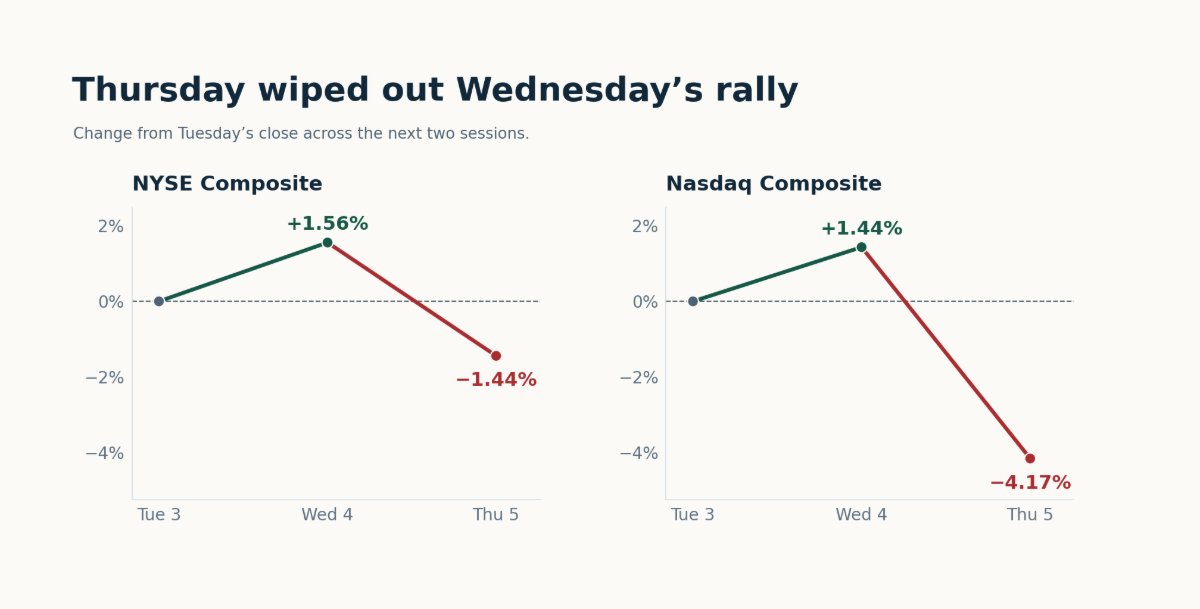
The chart starts at Tuesday’s close, so you can see where the two sessions left us.
Even after giving the indexes credit for Wednesday’s rally, the NYSE Composite was 1.4% below Tuesday’s close. The Nasdaq Composite was 4.2% below.
If it felt like everything on your watchlist was down, the numbers were pretty close to that.
I wanted to see how Thursday ranked against other big down days, then count how much of the market went down with it.
How Big Was the Drop?
The NYSE Composite fell 2.96% on Thursday. The Nasdaq Composite fell 5.52%.
It was the worst day of 2026 for both indexes. For either one, you have to go back to April 4, 2025, to find a bigger one-day loss:
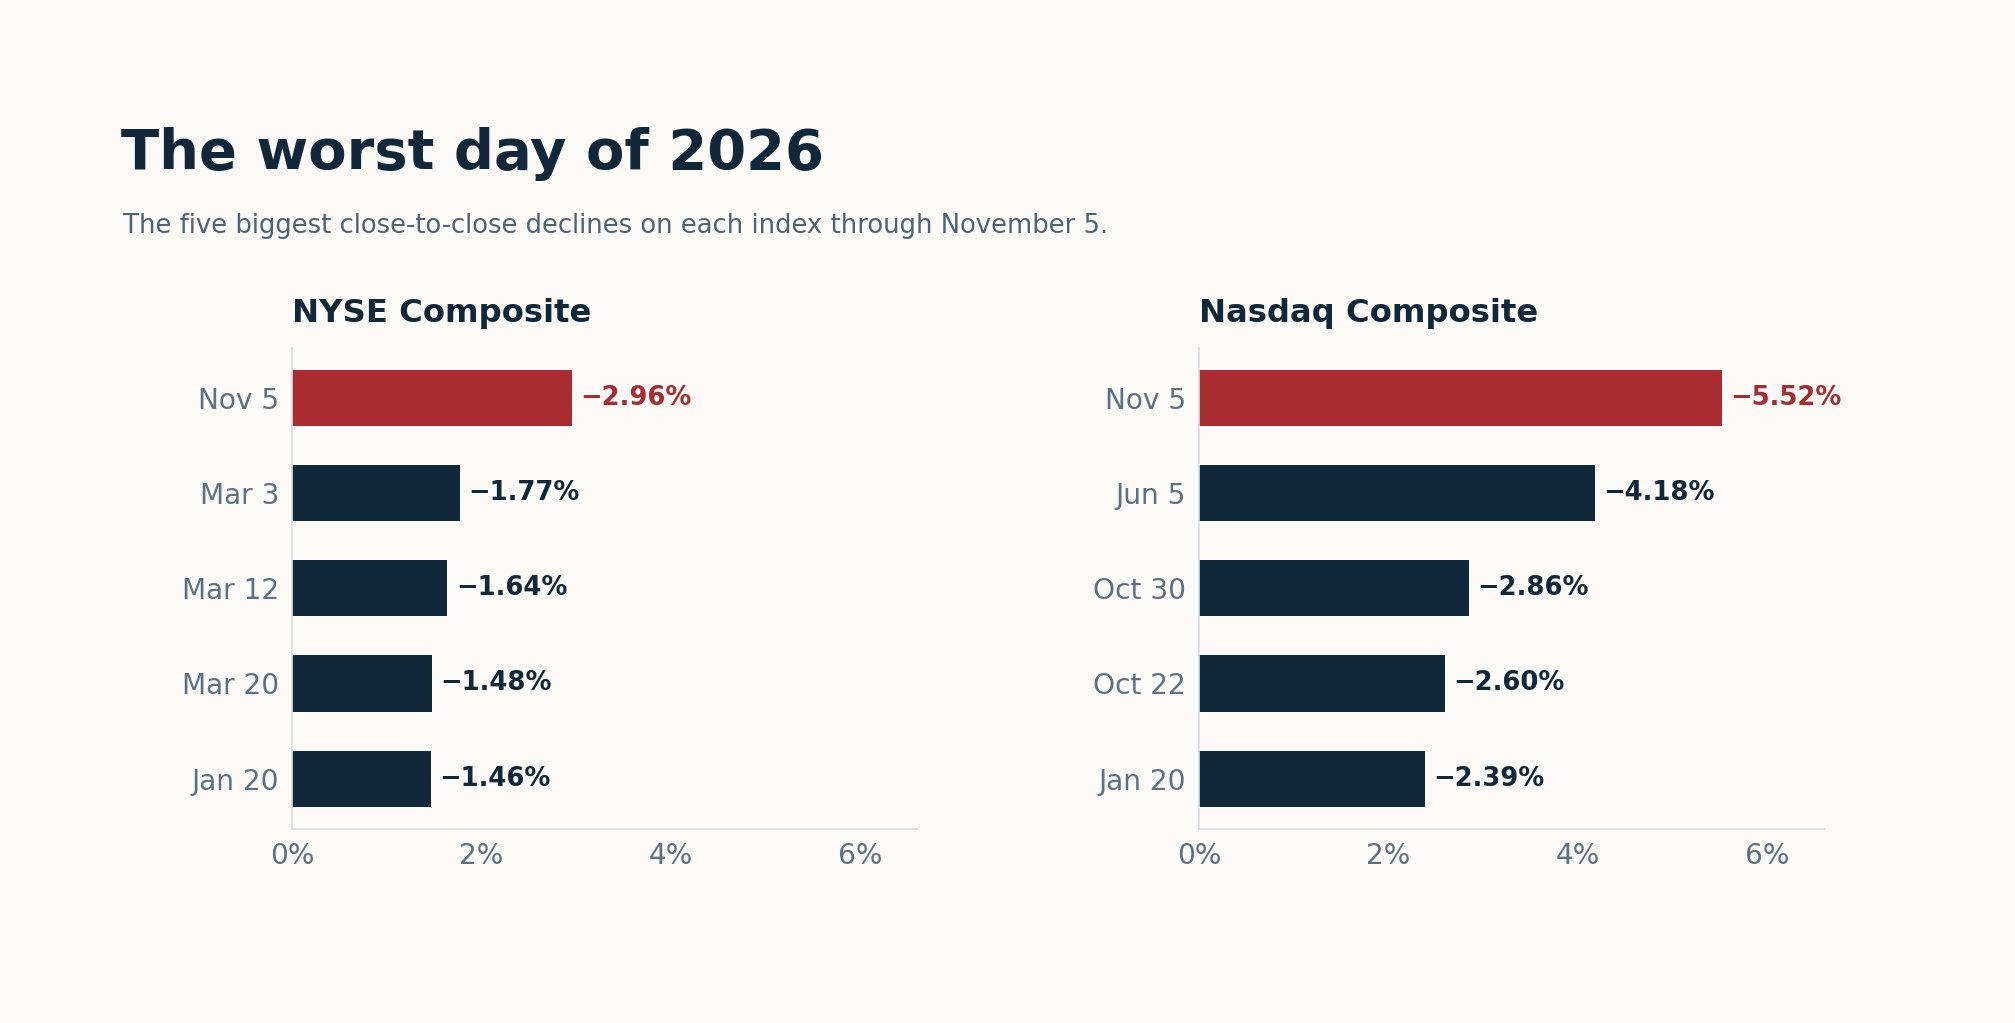
Look at the next bar down on each chart.
Before Thursday, the NYSE’s biggest daily drop this year was 1.77% in March. The Nasdaq had already fallen 4.18% in a day in June.
Thursday went well beyond both.
I also wanted to see what the drop looked like over a longer stretch.
So I went back to 1978 and ranked Thursday against every daily decline in the price history:
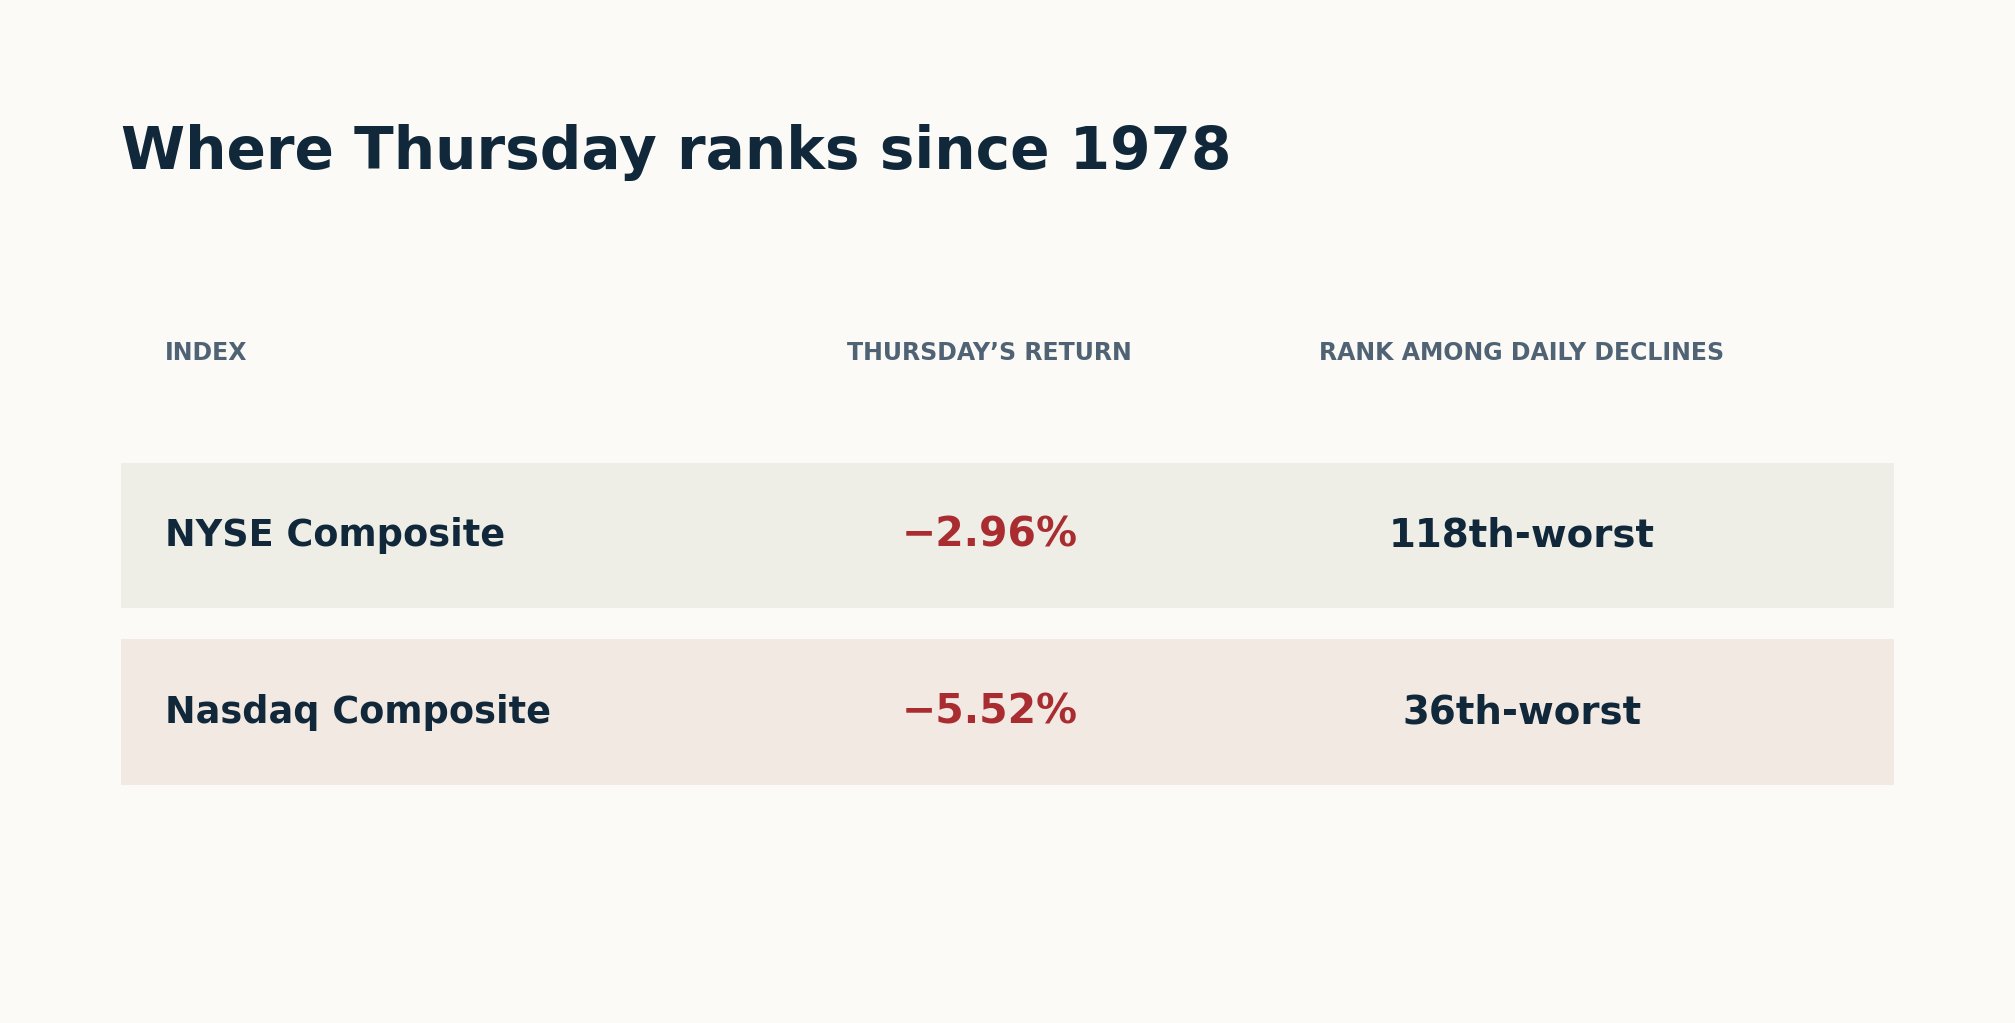
That’s where Thursday ranks on price. Then I counted how many issues fell.
How Much of the Market Went Down?
On Thursday, 2,336 issues fell on the NYSE, and 413 rose. On the Nasdaq, 4,086 fell, while 850 rose.
When I talk about breadth, this is what I’m counting. Each issue gets one vote.
To work out how widespread the selling was, I divide the number that fell by the total that rose or fell. Anything that finished unchanged sits out.
On the NYSE, 85% of moving issues fell. On the Nasdaq, it was 82.8%.
About five out of six on both exchanges.
Those were the worst breadth readings of 2026. So alongside the biggest index drops of the year, we had the biggest share of issues falling.
If you owned something that managed to finish higher, it was in a pretty small group.
Those numbers would have got my attention on any day.
What made me look again was how different the count had been at the previous close.
How Quickly Did It Turn?
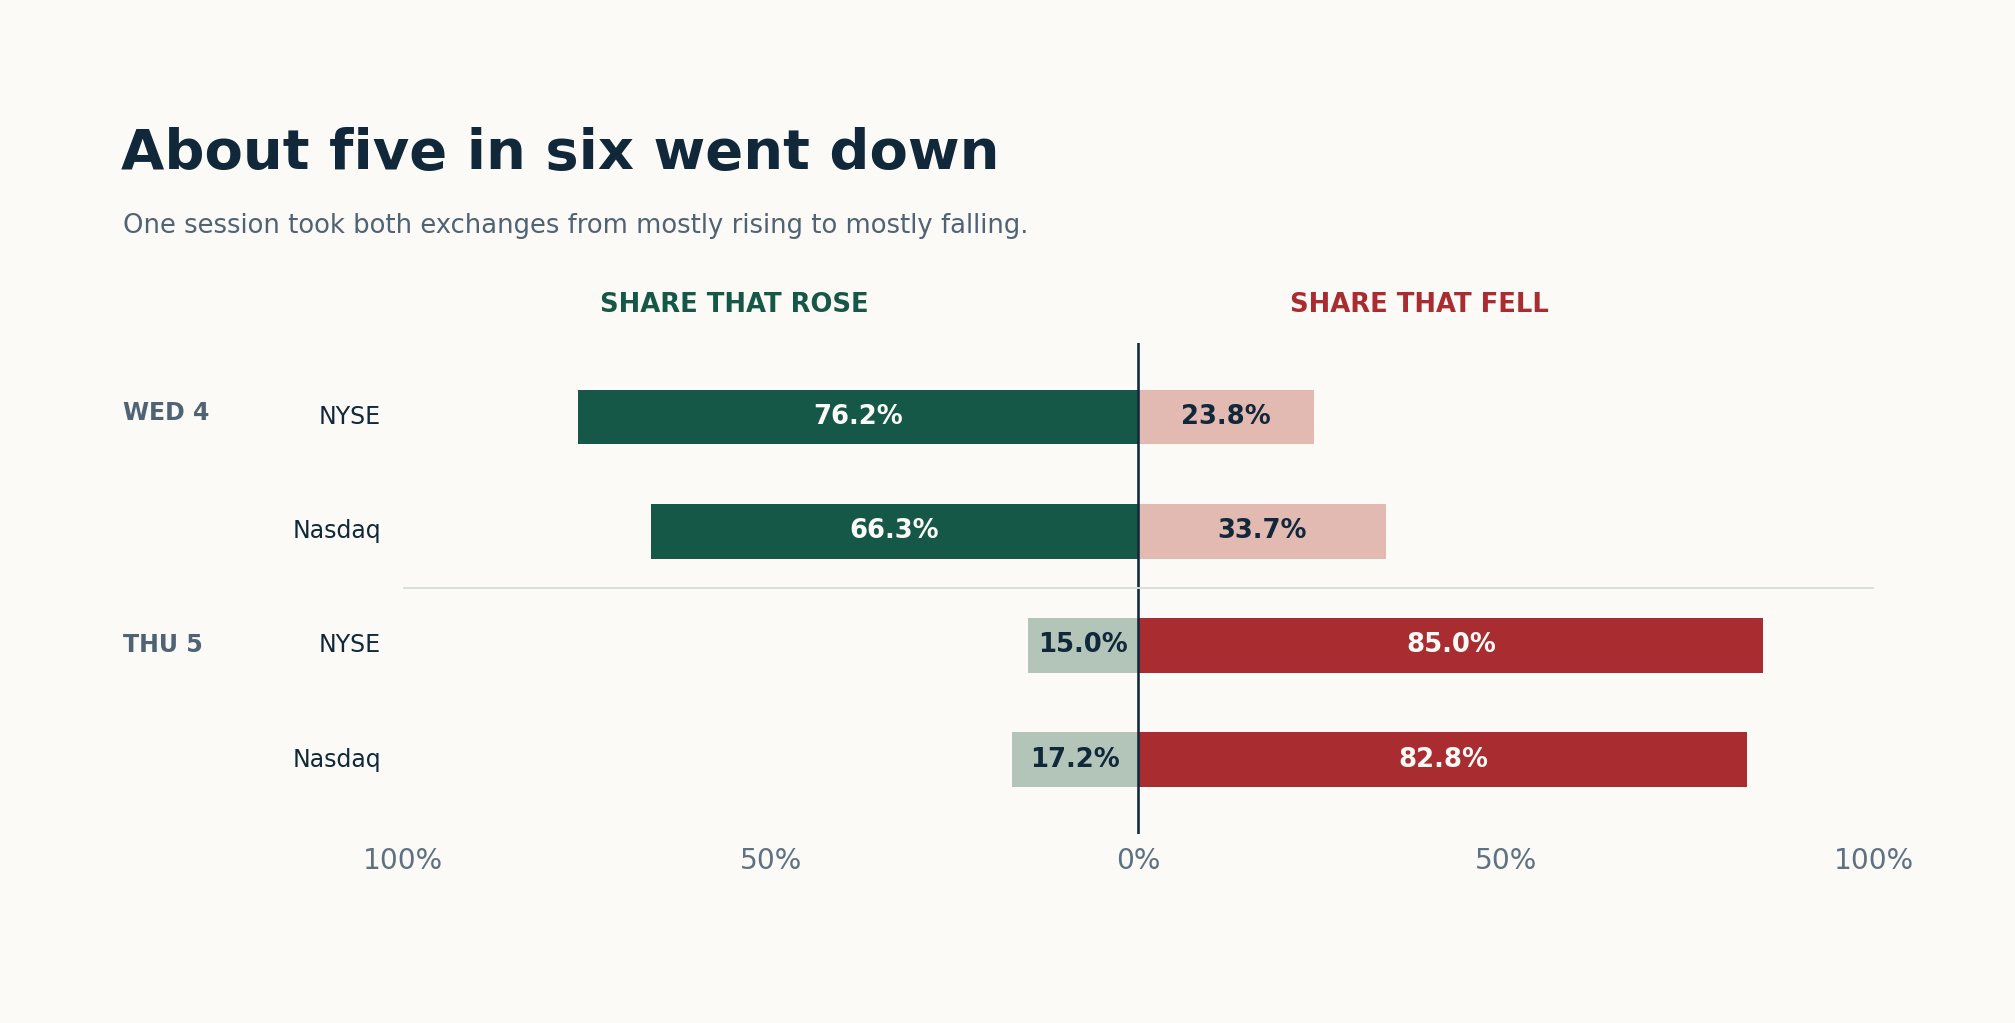
Start with the green bars on Wednesday.
On the NYSE, 76.2% of the issues that moved went up. On the Nasdaq, it was 66.3%. Most of the market was participating in the rally.
Then look at the red bars on Thursday.
In one session, both exchanges went from a clear majority rising to more than 80% falling.
Wednesday had given me the broad buying I’d been looking for. One session later, both exchanges had recorded their biggest one-day swing toward decliners all year.
The last time at least 80% of moving issues fell on both exchanges in the same session was May 21, 2025.
So What Am I Doing With It?
I’ll start with Wednesday’s closes.
If we get a bounce, those levels give me a simple way to see how much of Thursday’s loss buyers are getting back.
Then I’ll do the same count I did this week. How many stocks are going up with the indexes?
If the indexes break Thursday’s lows and most stocks are still falling, I’ll be more concerned. That would be another session of selling with most of the market going along with it.
In my last breadth note, I said I wanted to see more stocks join the advance.
Wednesday gave us a day of that. Thursday showed how quickly it can disappear.
Next time the buyers show up, I want to see them come back the day after.
Happy hitting🏌️⛳
Grant Hawkridge
Quantitative Analyst, Everybody’s Wrong