
Over the past few Saturdays, we’ve looked at breadth, the presidential cycle, and the S&P 500’s primary trend.
Different ways of examining the same market. And throughout those notes, I’ve kept coming back to participation.
Would more stocks start joining the advance?
On Thursday, one of the numbers I follow caught my attention. The percentage of S&P 500 stocks registering a 20-day high reached 50.1%.
Half the index.
After spending so much time counting stocks that had lost their trends, it was good to have something else to count.
But the number I’m waiting for is 55%.
Thursday brought us closer. To explain why I want to see a little more, we need to go back to something that expired in May.
What I’m Counting This Time
In my earlier breadth note, we looked at how many stocks were trading above their moving averages.
This time, we’re counting how many are reaching their highest price in 20 trading days, roughly a month.
Take that count, divide it by the number of stocks in the S&P 500, and we have another way of measuring participation.
Each stock gets a vote.
That’s useful because a handful of large companies can have a big influence on the index. They can help push the S&P 500 higher even when plenty of other stocks are struggling.
But they can’t produce a reading like Thursday’s on their own. For half the index to register new monthly highs, strength has to spread.
The trigger I use is straightforward: When 55% or more of S&P 500 stocks register a 20-day high, a breadth thrust fires.
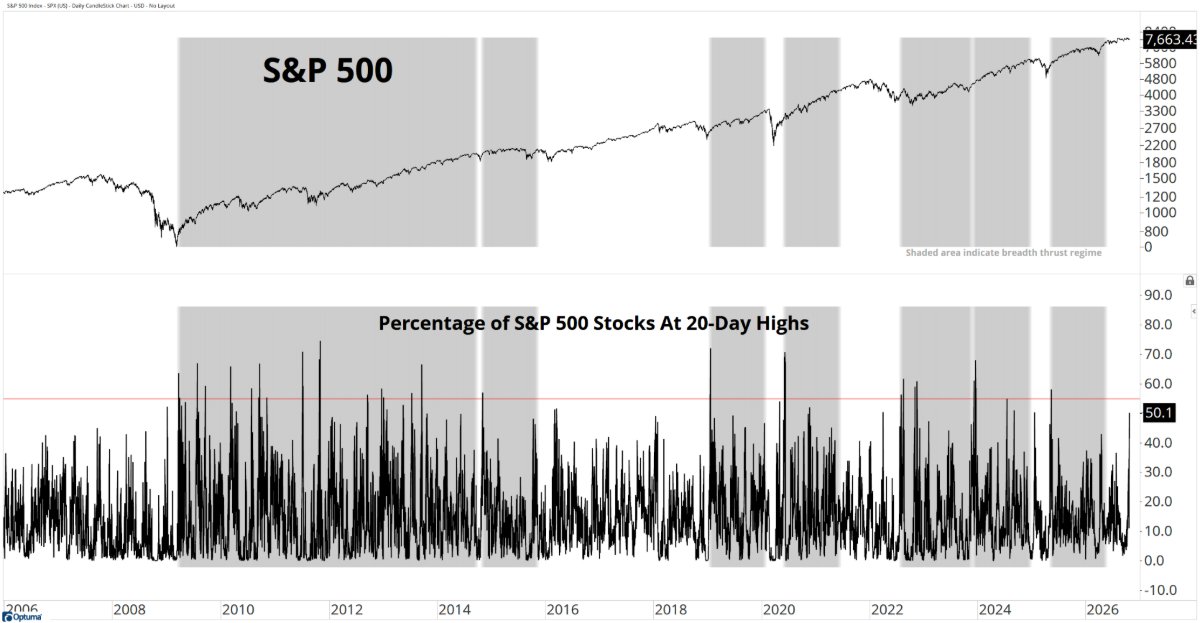
The lower panel tracks those daily readings. The horizontal line marks the 55% trigger, while the shaded areas identify the breadth thrust regimes.
Here’s how those regimes work.
A qualifying signal starts a 252-trading-day window, roughly one year. If another signal arrives, the clock resets.
If no new signal arrives, that window eventually expires.
The reading doesn’t have to stay above 55% throughout the year. We’re looking for a burst of widespread strength, then measuring how the market behaves afterward.
The most recent signal fired on May 12, 2025.
No further signal arrived to reset the clock, so the regime ended in May this year.
It simply ran out of time.
Plenty of Activity. Not Much Progress.
Since the final active close on May 13, the S&P 500 has gained just 2.9% through Thursday.
More than five months for less than 3%.
There have been rallies, pullbacks and new highs along the way. Plenty to follow each day. But compare where the index started with where it sits now, and it hasn’t travelled very far.
That can happen within a bull market.
In my last note, I explained why I wasn’t going to become defensive simply because the primary uptrend had been around for a while. The age of a trend, by itself, isn’t a reason to bet against it.
But a positive primary trend doesn’t mean the market will make steady progress every month.
Sometimes price runs ahead. Sometimes it spends months working through an earlier advance. And sometimes the index holds up while the stocks underneath it take turns pulling back.
That is why I keep looking beyond the headline number.
I’d like to see buyers make more progress. A fresh burst of broad participation would give me another reason to expect it.
The next chart explains why.
Where the Gains Have Accumulated
I separated the S&P 500’s daily returns into those earned during breadth thrust regimes and those earned outside them, then compounded each group.
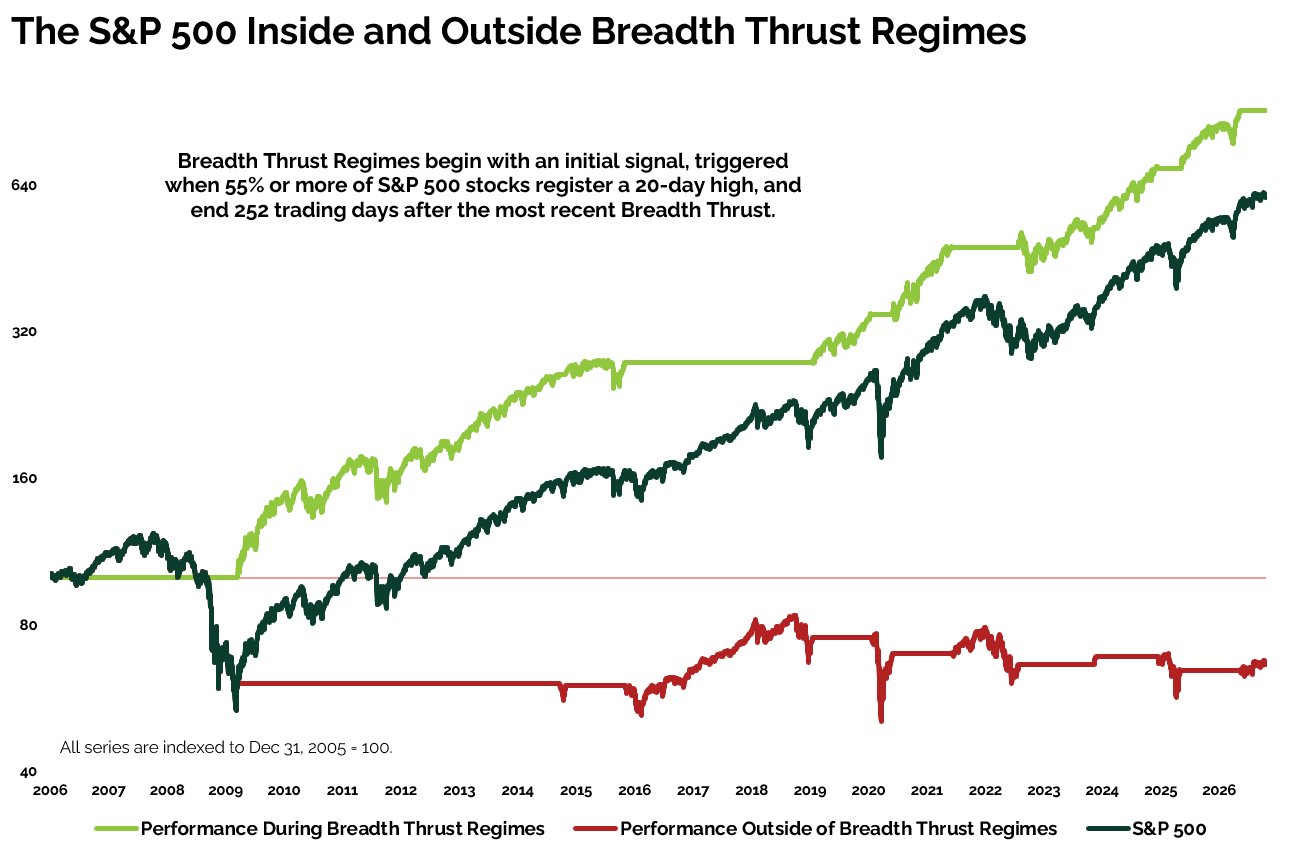
The green line tracks performance inside the regimes. The red line tracks performance outside them. The dark line is the S&P 500 itself.
Each regime line stays flat when it isn’t active.
Over the full period, the green line has accumulated substantial gains. The red line has finished below where it started.
There are exceptions along the way. You can see stretches when the market rallied outside a regime, and the green line certainly hasn’t avoided every correction.
But the difference over time is hard to miss.
The gains earned inside these windows more than account for the S&P 500’s net advance over the study.
That helps explain why I’ve been watching for another signal since May.
The index can rise without one. But, historically, the periods following these broad bursts of strength have been much more productive.
The modest progress over the past five months fits that pattern.
Now I want to see whether participation can improve enough to start a fresh window.
Why I’m Watching 55%
The next chart takes a different approach.
Instead of dividing the market into regimes, it compares individual breadth readings with the S&P 500’s return over the following 12 months, measured as 252 trading days.
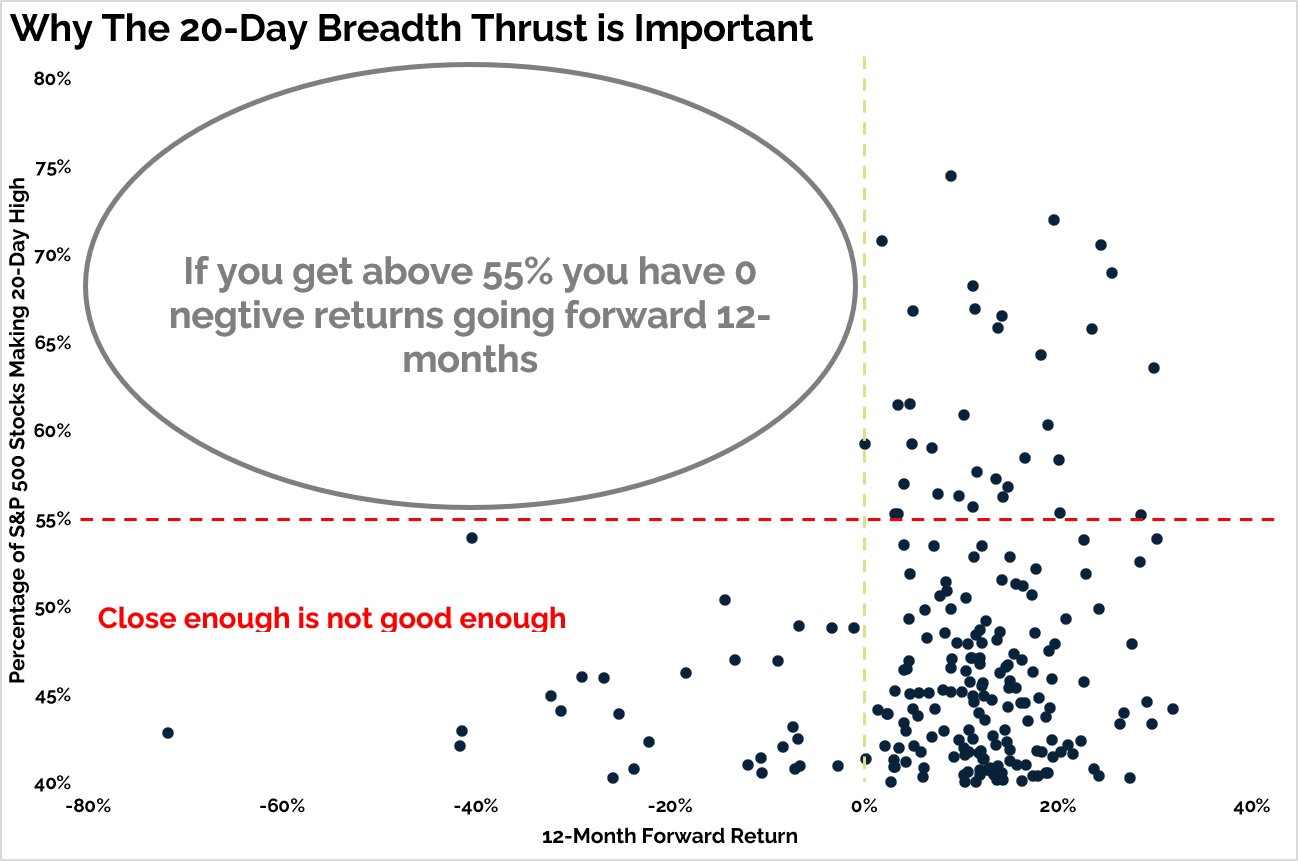
The percentage of stocks registering 20-day highs runs up the chart. The forward return runs across it.
Dots to the left of zero were followed by negative returns. Dots to the right were followed by positive returns.
Now look above the 55% line.
Every observation in that group sits on the positive side.
In the history studied, there wasn’t a negative 12-month result after a qualifying reading. That gets my attention.
Below the trigger, there are plenty of positive outcomes too. But the results are more mixed, with some sizable losses among them.
So I use 55% as a consistent rule for identifying the broad strength I want to see.
It doesn’t promise a smooth year. The chart compares where the S&P 500 started with where it finished, without capturing every pullback in between.
Some observations also come from the same market advance, and the next result could be different.
But the historical record gives me a reason to watch this closely.
When that many stocks reach new monthly highs together, I want to know about it.
So What Am I Doing With It?
Thursday’s 50.1% reading was encouraging. It also fell short of the trigger.
Both can be true.
I don’t need to move the rule because we’re getting close, and I don’t need to dismiss the improvement because we haven’t reached it yet.
What I want to see now is whether buyers can build on Thursday’s reading and take participation to 55% or more.
That would start a new breadth thrust regime and give me another reason to approach the months ahead from the bullish side.
It would also add something useful to the evidence we’ve discussed in these Saturday notes.
We’ve examined the seasonal window and the primary trend. A fresh breadth thrust would bring widespread strength across individual stocks into that picture.
Until then, I’ll keep following price and focusing on the stocks and sectors leading.
The S&P 500 has spent more than five months making limited net progress. I’d like to see it do more, and I’d like more stocks to help it get there.
Thursday got my attention.
Now I want to see 55%.
Happy hitting🏌️⛳
Grant Hawkridge
Quantitative Analyst, Everybody’s Wrong