
Back in January, I wrote about what I thought was one of the most important levels for the S&P 500 that I’d seen in a long time.
7,000.
It wasn’t because it was a nice round number, or because everyone on TV was talking about it.
It was because several completely different Fibonacci calculations, from completely different periods in market history, were all pointing to the same place.
We had extension levels from last year’s correction targeting just below 7,000. The extensions from the 2022 bear market were pointing to that same area.
Even when we zoomed all the way out, the message was the same.
That’s what made 7,000 so important.
And the market agreed.
The S&P 500 first ran into that area last fall, then spent the next five or six months trying to get through it.
Every time it got close, sellers showed up.
Eventually, it broke through.
And look what’s happened since:
The S&P 500 is up double digits in just a few months, and on Friday it closed the week at its highest level in history.
So, naturally, I’ve been getting a lot of questions about what the Fibonacci levels are telling us now.
The answer is actually pretty simple.
It Isn’t as Clean Anymore
Here are the updated extension levels from last year’s correction and the 2022 bear market:
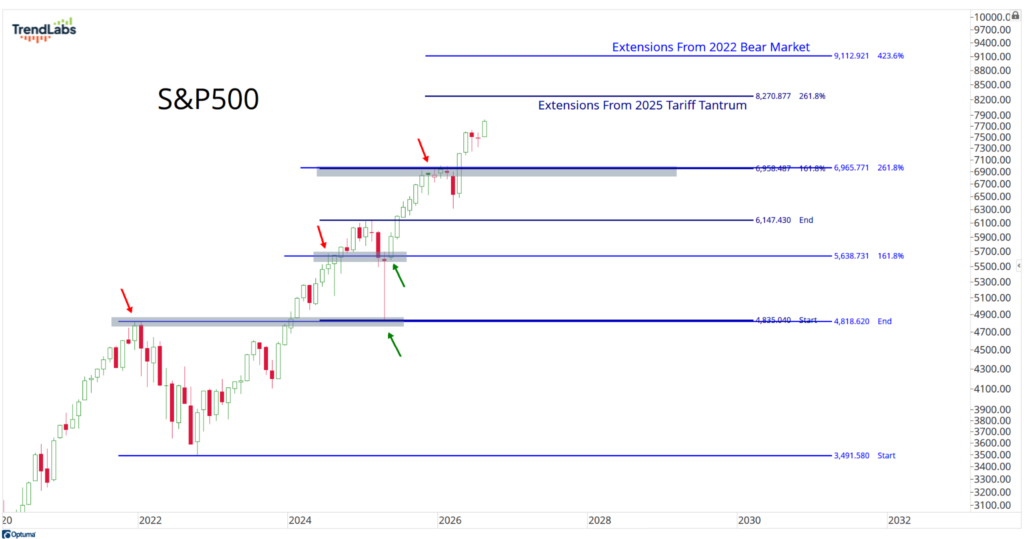
The first thing you’ll notice is that the levels above us don’t cluster together nearly as nicely anymore.
We have extensions from last year’s correction pointing to one area, extensions from the 2022 bear market pointing somewhere else, and the longer-term extensions from the Great Financial Crisis giving us another level entirely.
That’s very different from what we had at 7,000.
And I think that actually makes what happened there even more important.
We had several completely independent calculations all coming together in the same place, then the market spent months confirming that it mattered.
We don’t have anything like that above us right now.
That doesn’t mean the individual Fibonacci levels aren’t valuable. Of course they are, and I’m going to continue watching all of them.
But there’s no single level above us right now that I can point to and say, “This is the one,” the way I could with 7,000. They’re more spread out, and that’s OK.
There are going to be important levels along the way. There are going to be corrections along the way too.
That’s how this works.
Remember 7,000
Now let’s zoom all the way out, to the S&P 500 going back through the Great Financial Crisis.
If we’re looking for the next really important long-term Fibonacci extension, this is the chart I care about most.:
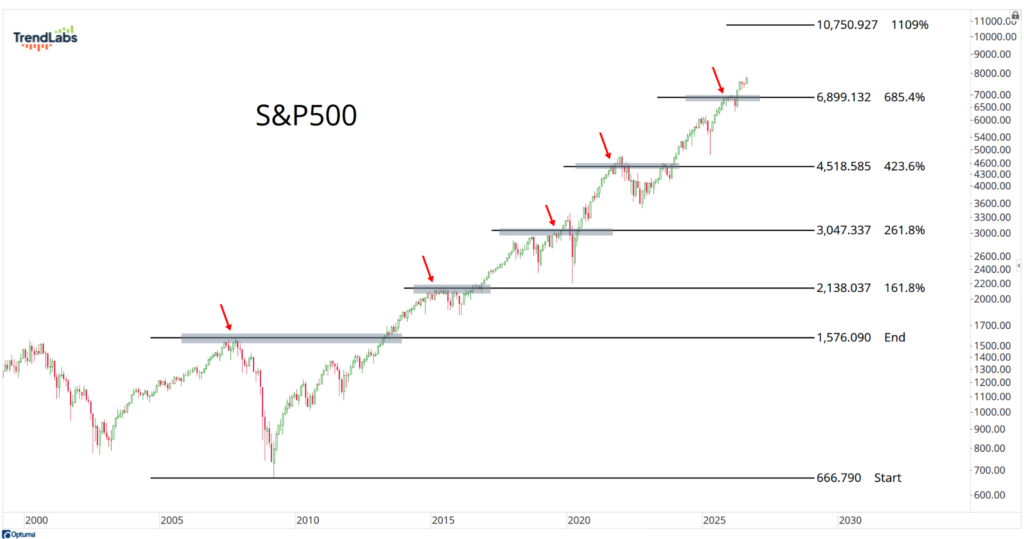
The next major extension comes in around 10,750. From where we are today, that’s still almost 40% higher.
Can we get there? I think we can.
But that doesn’t mean we’re going straight there.
You can see right on this chart that the S&P 500 didn’t move from one extension level to the next without plenty of corrections, consolidations, and headaches along the way.
I expect this time to be no different.
There are other Fibonacci levels between here and there from the 2022 bear market and last year’s correction.
We’ll keep watching those as we get closer, because those are the areas where I expect the market to pay attention.
But there’s another reason I’m writing this follow-up today.
I want you to remember 7,000. Maybe the S&P 500 never trades there again.
We’ve seen plenty of stocks blow through Fibonacci extensions and never look back, and maybe that’s exactly what happens here.
I have no idea.
But maybe we see 7,000 again in six months. Maybe it’s 12 months from now. Maybe it’s five years from now or even longer.
Whenever it happens, if it happens, I’m going to remember this.
Several Fibonacci calculations from completely different periods in market history all came together right around 7,000.
The S&P 500 then spent five or six months fighting with that level before it was finally able to break through.
Markets remember levels like that. Old resistance also has a funny way of turning into support.
So if the S&P 500 ever finds itself back around 7,000, particularly if everyone is scared and stocks have been selling off, that’s an area where I’m going to be looking very closely for opportunities to buy.
Maybe that day never comes.
But, when it does, we’ll be ready.
That’s really the point of all of this. Fibonacci isn’t about pretending we know exactly where stocks are going or when they’re going to get there.
It’s about identifying important levels ahead of time and then watching what the market does when it gets there.
7,000 told us a lot.
Now we move on to the next ones.
If you want to go back through exactly why 7,000 was so important, here’s Part 1 from January. And if you want a refresher on how I calculate these levels in the first place, here’s a video I did on the calculations.
The levels have changed.
The process hasn’t.
Stay sharp,
JC Parets, CMT
Founder, TrendLabs