If you know football at all, you’ve seen it. Big games don’t always come down to the stars on offense or defense.
Sometimes it’s a return, a blocked kick, a mistake on special teams that flips everything.
That one play ends up being the difference between winning and losing.
You play to win the game.
And I think utilities are your special teams. The group that doesn’t get the headlines, but can quietly win you the game.
They’re misunderstood.
People think they’re defensive. Only for bear markets. A place where they pay you a 3% to 4% yield, just to leave them alone!
That’s the narrative.
But you know how I always say the environment you grow up in shapes how you see markets?
My first five years in this business were during a powerful bull market.
And utilities were one of the best-performing sectors the entire time:
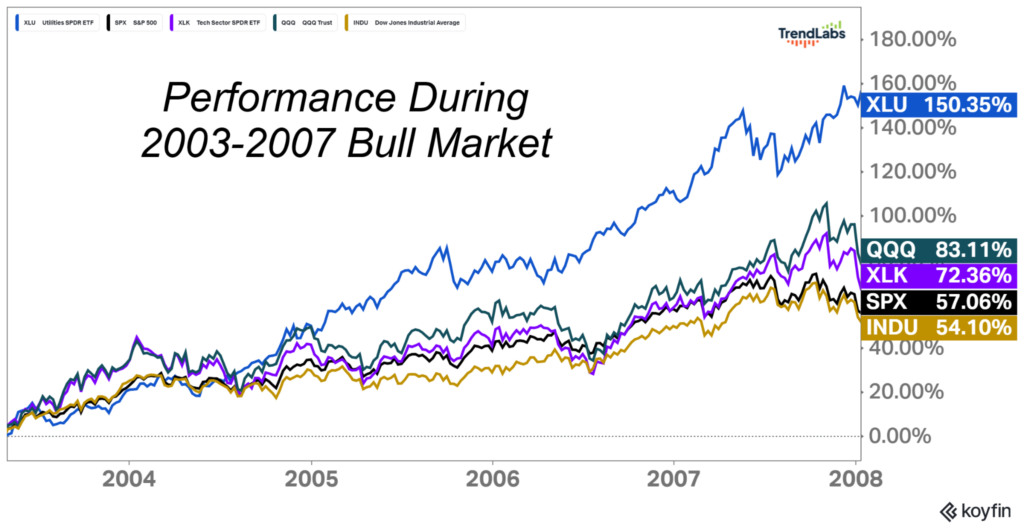
So when I hear people dismiss utilities in a bull market, I go right back to that period.
Because that’s not how it worked then.
And it might not be how it works now.
Special Teams Are Already on the Field
So far in 2026, large-cap utilities are outperforming the S&P 500, the Dow Jones Industrial Average, and the Nasdaq-100.
That’s not defensive. That’s leadership.
This isn’t some theory or “what if” scenario. It’s happening right now. And most people still aren’t paying attention.
But where it really gets interesting is beneath the surface.
Mid-cap utilities are already breaking out:
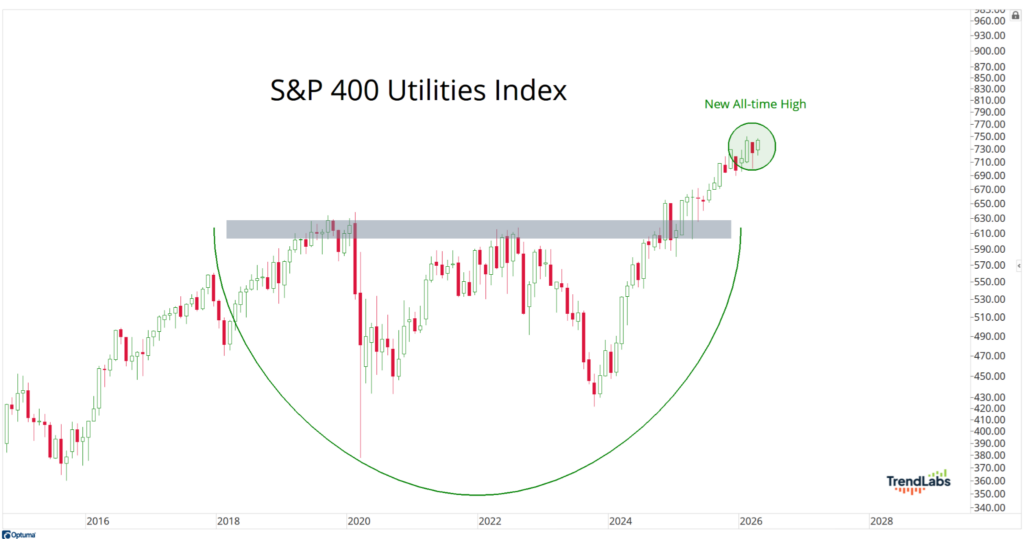
The S&P 400 Utilities Index is hitting new all-time highs.
That’s not defensive behavior. That’s leadership.
And then there’s small caps.
Quiet and ignored, they’re sitting right below a level that could trigger something much bigger:
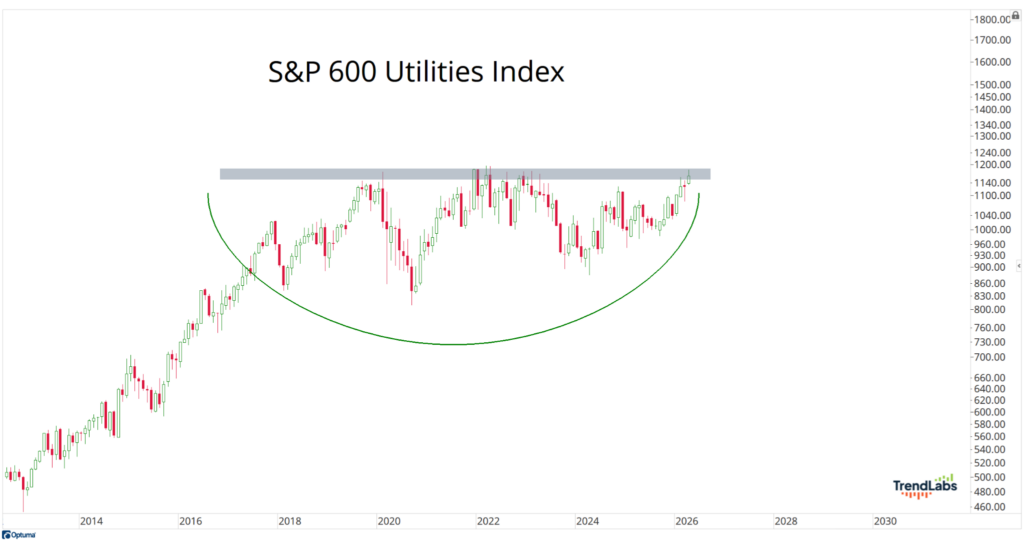
The S&P 600 Small-Cap Utilities Index is pressing against resistance/a potential breakout level.
That’s where the opportunity is.
There are 13 utility stocks in the S&P 600 and 15 in the S&P 400.
Go through them one by one.
Because if this group resolves higher, that’s not just a trade. That’s a tailwind.
Winning the Game
Here’s the thing about markets.
It’s always different.
People love to compare today to some other period. Last year. Ten years ago. The last cycle.
And sure, there will be similarities.
But the drivers are always shifting. Maybe it’s rates. Maybe it’s currencies. Maybe it’s sector rotation happening under the surface.
Something always changes. And that change is where the opportunity is.
Utilities might sound boring, like kicking a 25-yard field goal. But sometimes that one kick is the game.
That one group you ignored. That one trade you didn’t take.
That’s the difference between winning and losing.
So stay open-minded.
Pay attention.
Because special teams don’t need to be flashy.
They just need to show up when it counts.
Stay sharp,
JC Parets, CMT
Founder, TrendLabs