
I figured out how to turn $100,000 into $20 billion.
It only takes 20 years.
You start by buying the S&P 500. Then, every year, you simply avoid the 24 worst days in the stock market.
That’s it.
Do that from 2006 through the end of 2025, and your original $100,000 grows to $20,734,842,926.
Twenty billion dollars.
LOL.
Obviously, I can’t do this.
Neither can you.
Nobody knows ahead of time which 24 days are going to be the worst days of the year. If I did, I’d most likely still be writing to you every morning.
I’d just be doing it from one of my several islands.
But here’s where this gets fun.
Because Wall Street has been playing this exact same game with you for decades.
They just play it in the other direction.
You’ve probably seen the presentation before.
Your financial advisor pulls out a chart showing what would happen if you invested in the S&P 500 but happened to miss the market’s best days.
The results are horrifying.
Miss enough of the best days and your returns basically disappear.
And then comes the lesson: “See! This is why you have to stay invested.”
You never know when those great days are coming. So don’t sell. Don’t try to time the market. Just keep your money invested through everything.
And, conveniently, keep paying the person managing it.
The math isn’t wrong.
That’s what makes the trick so good.
They’re just showing you the part of the math that encourages you to do exactly what they want you to do.
Tommy Flipped the Math Around
My pal Tommy Lackey has seen these “best days” studies a million times, too, and apparently he had the same reaction I did.
What happens if we just flip the whole thing around?
So Tommy actually ran the numbers.
He started with $100,000 invested in SPY, the ETF that tracks the S&P 500, at the beginning of 2006.
If you simply bought it and held it through the end of 2025, your $100,000 grew to roughly $780,000.
Pretty darn good.
Then Tommy played Wall Street’s game.
He removed the 24 best days from every year.
Your $100,000 became…
$65.
Not $65,000.
Sixty-five dollars.
That’s the number they want you to see.
Look how dangerous it is to miss the best days! Stay invested! Don’t touch anything!
But then Tommy ran the same experiment in reverse.
Instead of removing the 24 best days every year, he removed the 24 worst days.
That’s how we got our $20 billion.
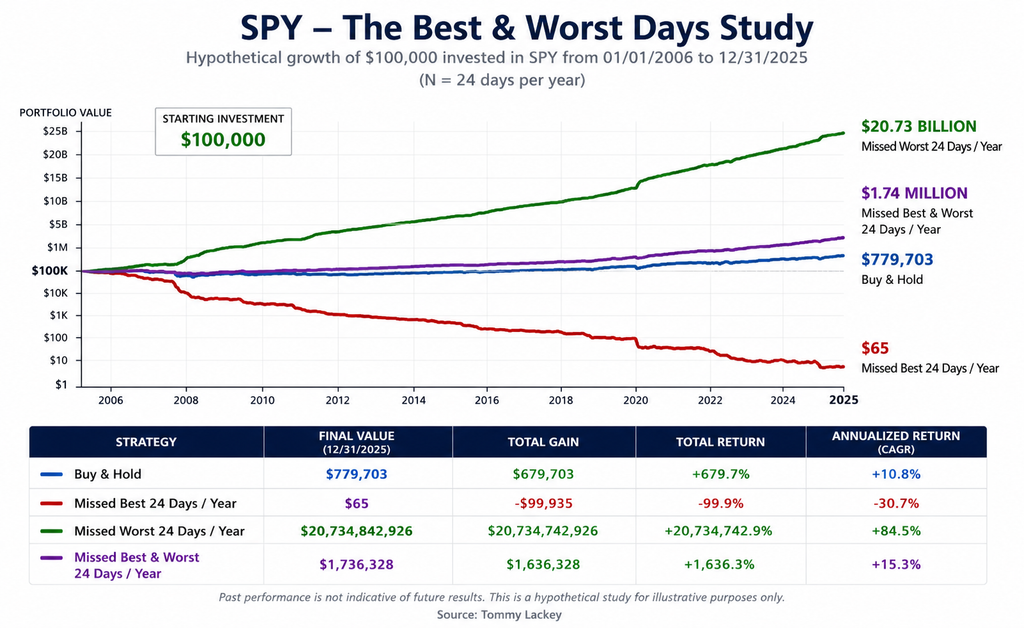
Look at that thing.
The blue line is what actually happened. “Buy and hold” turned $100,000 into about $780,000.
The red line is what happens if you magically miss the best days. You’re basically wiped out.
And the green line is what happens if you magically miss the worst days.
You turn $100,000 into more than $20 billion.
Your annual return jumps from about 10.8% for “buy and hold” to roughly 84% per year.
It’s completely absurd.
But that’s precisely why I love this study.
Tommy isn’t telling us he has a strategy that can identify the worst days before they happen. He doesn’t. Neither do I.
He’s showing us how ridiculous these hypothetical studies can become when someone gets to look backward and selectively remove days from history.
The investment industry has been doing exactly that forever.
They just happen to remove the days that produce the conclusion that’s best for their business.
Always Ask Who’s Holding the Calculator
And then Tommy did something even better.
He removed both the 24 best days and the 24 worst days every year.
This should be a disaster, right?
We’ve been warned our entire investing lives that missing those great days will destroy our returns.
Except it didn’t.
The original $100,000 grew to about $1.74 million.
That’s more than twice the $780,000 you made from buy and hold.
You missed the best days every single year and still crushed buy and hold because you also missed the worst ones.
Now we’re having fun.
There’s actually a useful lesson underneath all this.
The biggest up days and the biggest down days tend to happen around the same periods.
When markets get wild, they can move violently in both directions.
Some of the biggest rallies you’ll ever see happen right in the middle of terrible bear markets.
So when somebody shows me how dangerous it is to miss the biggest up days, I think it’s perfectly reasonable to ask why we’re pretending the biggest down days don’t exist.
Apparently missing those is pretty helpful too.
Twenty billion dollars helpful.
And that’s really what I want you to take away from this.
I’m not arguing against buy and hold. For a lot of people, buying stocks and owning them for decades is a perfectly reasonable strategy.
I’m certainly not suggesting anyone can magically avoid the worst 24 days every year.
I’m talking about something much more important.
Pay attention to who is showing you the data.
Financial advisors and asset managers generally get paid when you keep your money invested with them. The more money you have invested, the more money they make.
Again, there’s nothing wrong with that.
But when someone whose business depends on you remaining fully invested shows you a study proving why you should remain fully invested, you should probably understand the incentive.
That doesn’t make the study false. It makes it incomplete.
And that’s where investors get into trouble.
Numbers don’t have to be fake to mislead you. Sometimes you just need to show people one side of the equation and conveniently leave out the other.
That’s Wall Street’s favorite math trick.
So the next time someone shows you what happens if you miss the market’s best days, don’t argue with them.
Just ask one question:
What happens if I miss the worst ones?
Apparently, you wind up with $20 billion.
Thanks to Tommy Lackey for finally running the other half of the experiment.
Stay sharp,
JC Parets, CMT
Founder, TrendLabs