
Every stock has a birthday.
For a new public company, that birthday is its IPO.
Before that day, regular investors couldn’t just open their brokerage account and buy the stock. Once the company has its initial public offering, they can.
That’s the day the stock is born into the public market.
That’s when the game begins. And from that very first trade, we start keeping score.
We talked about this when SpaceX went public.
There was no 10-year chart to study. There weren’t old highs and lows from previous bull markets.
We couldn’t look back at how the stock behaved during the financial crisis or the pandemic.
None of that history existed yet. The market had to create its own starting point.
At TrendLabs, we call it the “Genesis Line.”
Think of it as the stock’s first breath after birth. Everything that happens from there can be measured against that moment.
The actual calculation has a complicated definition: the “volume-weighted average price since the IPO.”
But the idea behind it is incredibly simple.
We start from the day the stock went public and calculate the average price investors have paid ever since, giving more weight to the prices where the most shares traded.
That’s it.
If the stock is above that line, the average buyer since the IPO is making money.
If the stock is below it, the average buyer is losing money.
My parents always told me not to hang out with losers.
I don’t know what your parents told you.
But when it comes to stocks, I think mine had the right idea.
Hang Out With Winners
This is why the Genesis Line can be so useful.
Stocks behave differently when most of the people who own them are making money.
Think about buying a stock at $50 and watching it climb to $60.
You’re feeling pretty good. You’re not desperate to sell. If anything, you might want to buy more.
Now imagine buying that same stock at $50 and watching it fall to $40.
You’re probably not feeling quite as good anymore.
Maybe you’re waiting for it to get back to $50 so you can sell and “get your money back.”
Millions of investors making those decisions create supply and demand.
That’s what we’re trying to measure.
Above the Genesis Line, the average buyer since the IPO is winning.
Below it, the average buyer is losing.
I’d rather hang out with the winners.
And right now we have three really interesting examples.
The first is Cerebras (CBRS).
Cerebras came public just before SpaceX (SPCX) and raised a ton of money in the process. That gave us a brand-new stock with a brand-new Genesis Line.
Here’s what’s happened since:
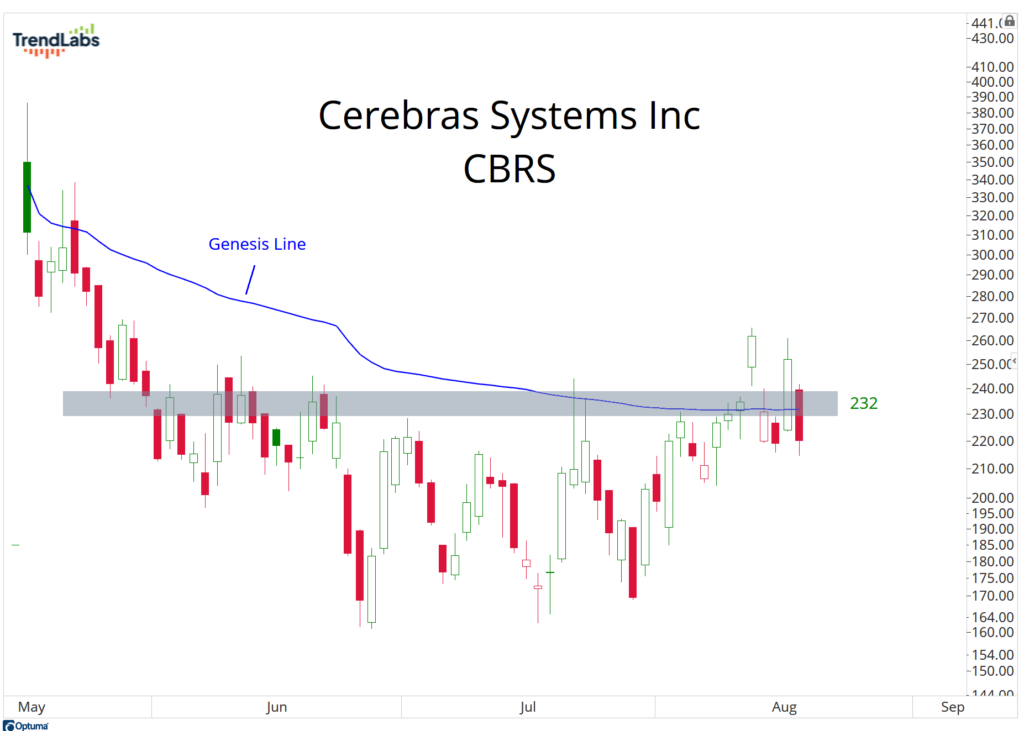
Don’t overcomplicate the chart.
Look at the price. Look at the line.
Is the stock above it or below it? That’s the question.
Then came SpaceX.
We knew this would be one of the biggest and most closely watched IPOs in history. But we also knew something else.
Once the stock started trading, we weren’t going to treat SpaceX differently just because it’s SpaceX.
We’re going to treat it like every other stock.
Price is price.
So, from the moment SpaceX began trading, we started calculating its Genesis Line:
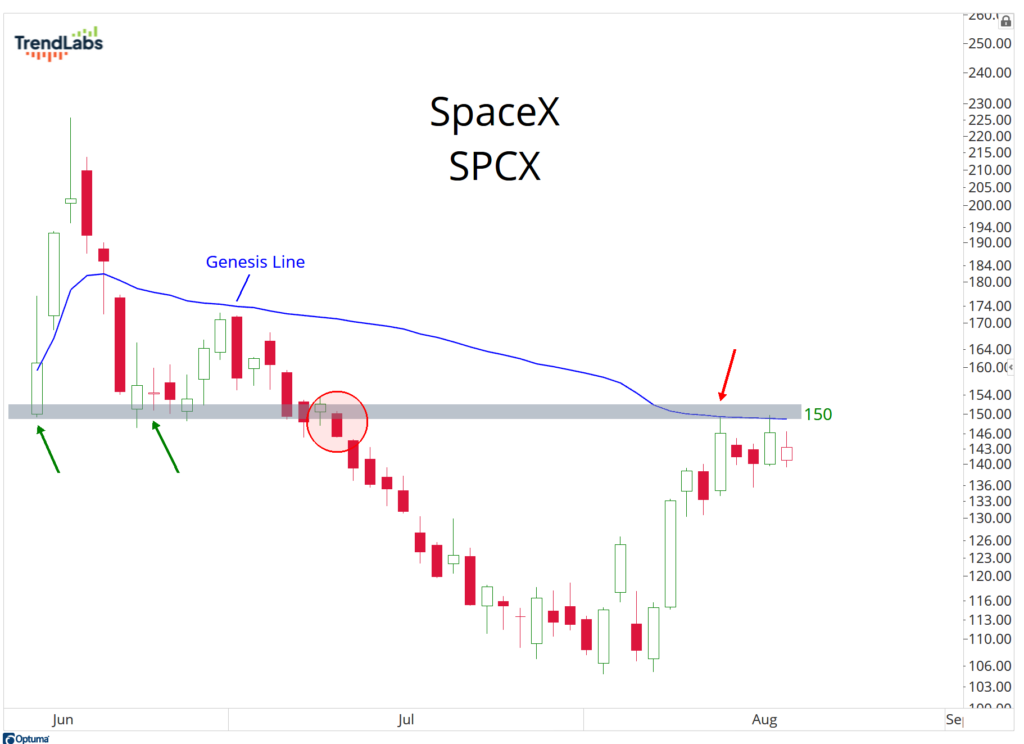
Every day that goes by gives us more information.
Every share that trades helps establish where buyers have been willing to put their money.
And every day we can ask the same simple question:
Are the buyers winning or losing?
The Next One Is Here
Now we have another one to watch. And SK Hynix (SKHY) has been around for a long time.
It’s one of the biggest semiconductor companies in the world and a major producer of the memory chips being used in the artificial intelligence boom.
Until now, its stock has primarily traded in South Korea.
But SK Hynix just raised $26.5 billion as part of its move toward a U.S. listing.
And for the first time, American investors can watch this new chapter develop under the ticker SKHY.
That gives us another starting point.
Another birth.
Another Genesis Line:
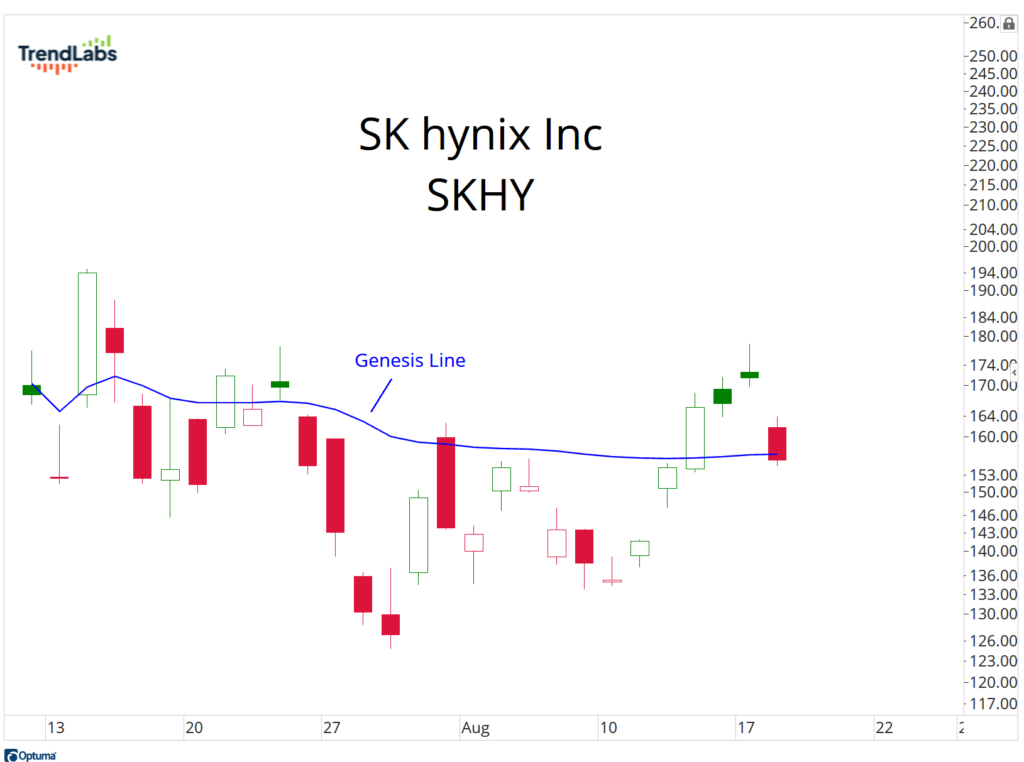
You might notice all three of these stocks doing some version of the same thing.
My friend Kenny calls it the “VWAP Shuffle.”
New stocks will often spend some time dancing above and below their Genesis Line while buyers and sellers fight it out.
Eventually, the shuffle ends and the stock makes its move.
CBRS, SPCX and SKHY are all doing some version of that right now.
SKHY is a little different from SPCX and CBRS because the public company itself isn’t new.
SK Hynix has been making chips for decades and trading on the Korean exchange.
What’s new is SKHY trading here in the U.S., with a new group of investors buying and selling it.
So we’re keeping score from the beginning.
That’s really what the Genesis Line is, a scoreboard.
You don’t need to understand the math behind volume-weighted average price to use it. You don’t need to know how semiconductors are manufactured or how rockets get into space.
You just need to understand what the line is telling you.
Above it, the average buyer is winning. Below it, the average buyer is losing.
That doesn’t mean every stock above the line is a buy. And it doesn’t mean every stock below it is going to crash.
Nothing in markets is that easy.
It’s simply one more piece of evidence.
But particularly with new stocks that don’t have years of trading history for us to study, it’s one of my favorite pieces of evidence.
CBRS has one now. SPCX has one.
And SKHY has one, too.
Three stocks. Three starting points. Three scoreboards.
And as these stories develop, we’ll keep coming back to the same questions.
Are we hanging out with the winners? Or are we hanging out with the losers?
Stay sharp,
JC Parets, CMT
Founder, TrendLabs