
The stock market is at all-time highs. Investors have been buying stocks, and, apparently, they’re holding less cash because of it.
Thanks.
That’s the big revelation making the rounds this week.
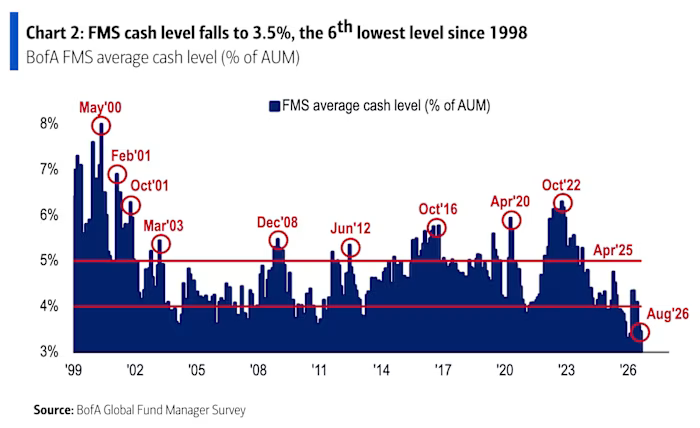
According to the Bank of America Global Fund Manager Survey, fund managers are now holding just 3.5% of their assets in cash.
That’s the sixth-lowest cash level since 1998.
And the way this chart is being passed around, you’d think we’re supposed to be worried.
I’m not.
Before we turn this into some complicated Wall Street indicator, let’s use a little common sense. Why would fund managers have less cash?
Because they spent it. And what did they spend it on? Stocks.
Where are stocks? At all-time highs.
So yes, investors have been buying stocks during a bull market. We already knew that.
Low Cash Is Not a Sell Signal
The argument goes something like this: If investors are holding very little cash, they must already be heavily invested.
And if everybody’s already invested, who’s left to buy?
It sounds reasonable. The problem is that history tells a different story.
In fact, this is almost exactly what we talked about last week with Bank of America’s Bull & Bear Indicator.
That indicator is also flashing a supposed “sell signal” largely because investors are buying stocks, credit markets are healthy, and more stocks are participating.
I ran the numbers on those signals, and the results weren’t very bearish at all.
Look back at other periods when cash levels were very low and you’ll find plenty of times when stocks just kept going.
Cash levels were low around 2004 and stocks continued higher. They were low again around 2006 and stocks kept rising.
They were also low in 2013, which turned out to be an incredible time to own stocks.
Were there bad periods when cash levels were low too? Of course. That’s the point.
Low cash levels have occurred before both good and bad periods for stocks. By themselves, they don’t tell us very much about what comes next.
A lot of the time, they’re simply telling us what already happened: Investors have been buying stocks.
That tends to happen when stocks are going up.
Wake Me Up When Cash Piles Up
The other side of this chart is much more interesting to me.
Look at what happens when fund managers are holding a lot of cash. We saw it in March 2003, December 2008, June 2012, October 2016, April 2020 and October 2022.
Those were periods when investors were scared. Instead of buying stocks, they were selling them and hiding in cash.
And many of those periods turned out to be fantastic times to buy.
That makes sense to me. When everybody is scared and sitting on piles of cash, there is plenty of money available to come back into the market if conditions improve.
That’s why I pay much more attention to extreme pessimism than extreme optimism.
High cash levels tell me investors are afraid. Low cash levels tell me investors have been buying stocks.
Right now, stocks are at all-time highs, investors have been buying them, and cash levels have fallen.
Duh.
I don’t see that as a sell signal. I see it as evidence of what’s already been happening during this bull market.
Wake me up when everybody starts selling stocks and piling into cash.
That’s when this chart gets interesting.
Stay sharp,
JC Parets, CMT
Founder, TrendLabs