
I’ve written plenty about the CNN Fear & Greed Index over the years.
My problem has never been that sentiment doesn’t matter. It does.
My problem is when we take signs of a healthy bull market, call them “extreme greed,” and then assume that means stocks have to go down.
Well, we’re back here again.
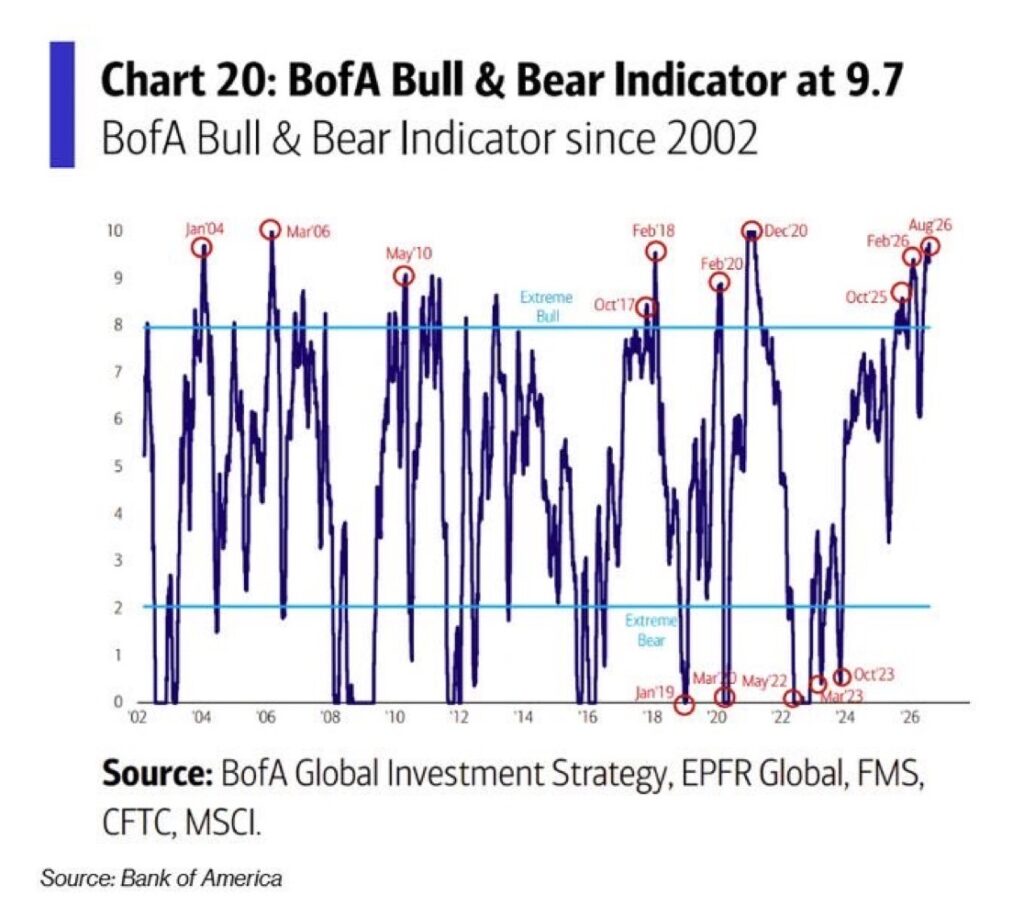
This time it’s Bank of America’s Bull & Bear Indicator.
It goes from 0 to 10.
When it gets above 8, Bank of America calls that an “extreme bull” reading and considers it a sell signal.
When it falls below 2, that’s an “extreme bear” reading and a buy signal.
Right now?
It’s at 9.7. That’s almost as bullish as it can possibly get:
Sounds scary.
Until you look at what’s actually in it.
The indicator combines things like hedge fund positioning, long-only investor positioning, money flowing into stocks and bonds, credit markets, and stock market breadth.
In plain English, it’s asking questions like:
Are investors buying stocks? Are more stocks around the world participating?
Are credit markets healthy? Are professional investors positioned for stocks to rise?
Right now, the answers are mostly yes.
And somehow we’re supposed to conclude that all of this is bad for stocks?
Apparently, good things happening is bearish.
But there’s another problem.
If investors are supposedly experiencing some historic level of bullishness, where are all the bulls?
The AAII survey actually asks individual investors whether they think stocks will be higher or lower six months from now.
We’ve now had four straight weeks with more bears than bulls.
Meanwhile, consumer sentiment is still sitting near some of the lowest levels in history.
Think about how strange that is.
Bank of America is telling us investors are so bullish that its indicator is almost maxed out at 9.7 out of 10.
But when we actually ask individual investors how they feel about stocks, there are still more bears than bulls.
And when we ask consumers how they feel, they’re still miserable.
So how do we reconcile that?
I think the answer is pretty simple.
Bank of America isn’t really measuring how bullish people feel.
It’s measuring what they’re doing.
Money is flowing into stocks. Professional investors are positioned in stocks.
Credit markets are healthy. More stocks around the world are participating.
Those things are pushing the indicator toward 10.
But that’s not necessarily extreme optimism.
That might just be what a bull market looks like.
I Can’t Believe I’m Defending Fear & Greed.
I still don’t think the CNN Fear & Greed Index is particularly useful as a market timing tool.
But I’ll give it this.
At least some of the things it measures are actually related to sentiment.
CNN uses seven indicators. It looks at the S&P 500 relative to its trend, new highs vs new lows, market breadth, options activity, volatility, junk-bond spreads, and the performance of stocks vs bonds.
Volatility and options activity can tell us something about how nervous investors are.
Credit spreads can tell us how willing investors are to take risk.
But I still don’t think combining all of those things into one big “Fear & Greed” number tells us whether stocks are about to go up or down.
But at least there is some actual sentiment in a sentiment indicator.
That’s where I have a much bigger problem with the Bank of America Bull & Bear Indicator.
Where is the sentiment?
Money flowing into stocks? Too bullish.
More global stock markets participating? Too bullish.
Healthy credit markets? Too bullish.
Professional investors owning stocks? Too bullish.
Those aren’t measures of how investors feel. They’re measures of what investors and markets are actually doing.
And we know there’s a difference because we can actually ask investors how they feel.
The AAII Sentiment Survey does exactly that.
It asks individual investors whether they expect stocks to be higher, lower or about the same six months from now.
We’ve now had four straight weeks with more bears than bulls.
Meanwhile, consumer sentiment remains near some of the lowest levels in history.
So how do we reconcile that with a Bank of America indicator sitting at 9.7 out of 10 and supposedly showing “extreme bullishness”?
I think that’s the most interesting part of all of this. Investors can feel bearish while behaving bullishly.
They can complain about the economy and still buy stocks.
They can tell a survey they’re bearish while the S&P 500 keeps going up.
Professional investors can increase their exposure because stocks are rising, whether they feel great about the world or not.
And more stocks can participate simply because we’re in a healthy bull market.
That’s not extreme bullish sentiment.
That’s a bull market doing bull market things.
Which brings us to the question that actually matters:
Does any of this tell us that stocks are about to go down?
Fortunately, we don’t have to guess.
So I Ran the Numbers
Fortunately, Bank of America’s own chart gives us the opportunity to test this.
They circled the previous “extreme bull” readings going all the way back to 2004.
So instead of assuming an extreme bullish reading must be bearish, I wanted to know what actually happened to stocks afterward.
Six months after these “extreme bull” signals, the S&P 500 was up an average of 4.8%. Stocks were higher six out of seven times.
After 12 months? Up 12.5% on average. Stocks were higher every single time.
After 18 months? Up 13.5% on average. Again, higher every single time.
After 24 months? Up 16.1% on average. Once again, higher every single time.
That’s quite a sell signal.
And to be fair, Bank of America describes this as a contrarian indicator with a much shorter time horizon, roughly one to three months.
But even there, the evidence isn’t exactly overwhelming.
Four of the seven completed historical signals were followed by a higher S&P 500 one month later.
Three of seven were higher after three months.
That’s basically a coin flip.
The bigger problem is the assumption underneath the whole thing.
Bullish behavior doesn’t automatically become bearish just because there’s a lot of it.
In a healthy bull market, we should expect investors to buy stocks, participation to expand, and risk appetite to improve.
That’s what bull markets look like.
Eventually, those conditions can change. And when they do, we’ll see the evidence.
But simply reaching some arbitrary level of “too bullish” doesn’t tell us when that will happen.
That’s why these indicators can be so dangerous when people try to use them as timing tools.
Bull markets create bulls.
Rising stocks attract money. Healthy markets produce strong breadth.
Professional investors eventually have to own the things that keep going up.
And the stronger the bull market gets, the more “extreme” these indicators can become.
That doesn’t tell us when the trend is going to end.
If anything, the history on Bank of America’s own chart shows just how dangerous that assumption can be.
Every completed extreme-bull signal shown here was followed by a higher S&P 500 one year later.
Every one was higher 18 months later. Every one was higher two years later.
So yes, the BofA Bull & Bear Indicator is screaming that investors are extremely bullish.
I agree with part of that. Investors are buying stocks.
But individual investors are still telling us there are more bears than bulls.
Consumers are still telling us they feel terrible.
And yet stocks keep going up, breadth remains healthy, and money keeps finding its way into the market.
Maybe that isn’t some giant warning sign.
Maybe investors aren’t euphoric at all.
Maybe they’re just slowly being forced to admit that we’re still in a bull market.
Stay sharp,
JC Parets, CMT
Founder, TrendLabs