
Founder’s Note: Grant Hawkridge always shares an informative and entertaining read when he’s up on Saturday.
He’s developing a knack for writing about life and market lessons in a memorable way.
The key is to put good tools to work when and where necessary… – JC
By Grant Hawkridge
Health has been on my mind a lot lately, partly because of what we’re seeing in the market, but mostly because of what’s been happening in my own life.
Over the past 16 months, I’ve lost around 40 kilograms, or roughly 88 pounds. It’s been a pretty significant change, and obviously I feel much better for it.
But I’m also at a point where simply losing more weight is no longer the main objective. I want to understand what’s actually happening underneath the surface.
Most of us make a lot of decisions about our health based on what we can see or how we feel. The scales say one thing, the mirror says another, and we make changes based on what we think the problem might be.
Sometimes that works. But it’s still largely based on an assumption.
Last week, I decided to get a much better baseline.
I had a full blood panel done. They took eight vials of blood and tested more than 50 different markers.
For the first time in this next stage of the journey, I had something much more useful than a feeling. I had data I could actually work with.
I could see the areas that looked good, the areas that could be improved, and where I should focus over the next few months.
Rather than trying to change everything at once, I could start putting more attention into the things that actually needed it.
That is what I’m going to be doing over the next 120 days.
A friend of mine has been building a more data-driven health coaching program, and I’m going to put myself through the process.
The idea is simple: Establish the baseline, identify the biggest opportunities for improvement, target those areas, and measure the progress.
One hundred twenty days takes me into the beginning of summer here in Australia, so it gives me a pretty clear window to work with.
The more I thought about that process, the more familiar it sounded.
Because this is basically how I’ve approached markets for years.
The Readings Come First
I don’t want to guess which sector should be leading, and I don’t want to decide that something looks attractive simply because the story makes sense.
I want to start with the readings and let the evidence narrow the field.
Price tells me what investors are actually doing. Relative Strength tells me which areas are outperforming, while Momentum helps me understand whether that strength is continuing or beginning to fade.
Our Alpha Score brings those readings together into one number. It combines Trend, Relative Strength, and Momentum so we can compare one area of the market against another using the same process.
It’s not all that different from looking at a blood panel.
One marker by itself can be useful, but it rarely gives you the complete picture. You get a much better read when several pieces of evidence start pointing in the same direction.
The same is true in markets. One strong week does not suddenly make a sector a leader.
Persistence does.
And for the past six weeks, Healthcare has continued to give us exactly that.
Six Weeks Near the Top
Healthcare has ranked inside the top three of the 11 sectors we track by Alpha Score for six straight weeks:
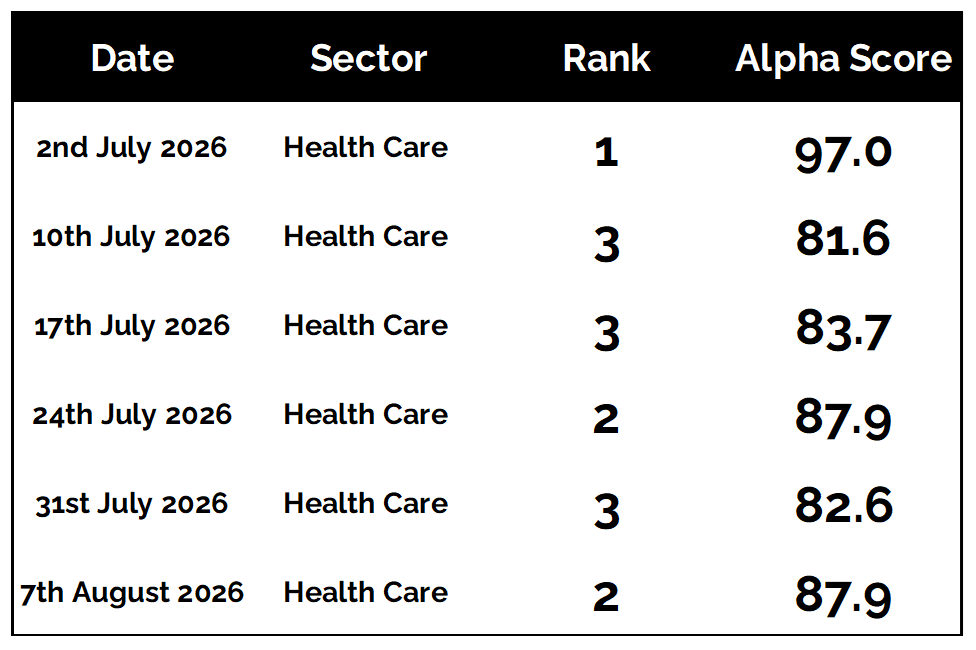
The individual score has moved around from week to week. What hasn’t changed is Healthcare’s position near the top of the rankings.
Sector leadership changes all the time. A strong week can disappear quickly if Trend, Relative Strength, and Momentum begin to weaken.
Healthcare has continued to hold up.
For a month and a half, it has remained among the strongest areas of the market based on the same process we use to compare all 11 sectors.
And the Alpha Score is not the only evidence supporting that view.
Price is now joining the conversation.
The Breakout Changes the Conversation
Healthcare has now broken above the resistance that capped the sector through 2024 and again during 2025:
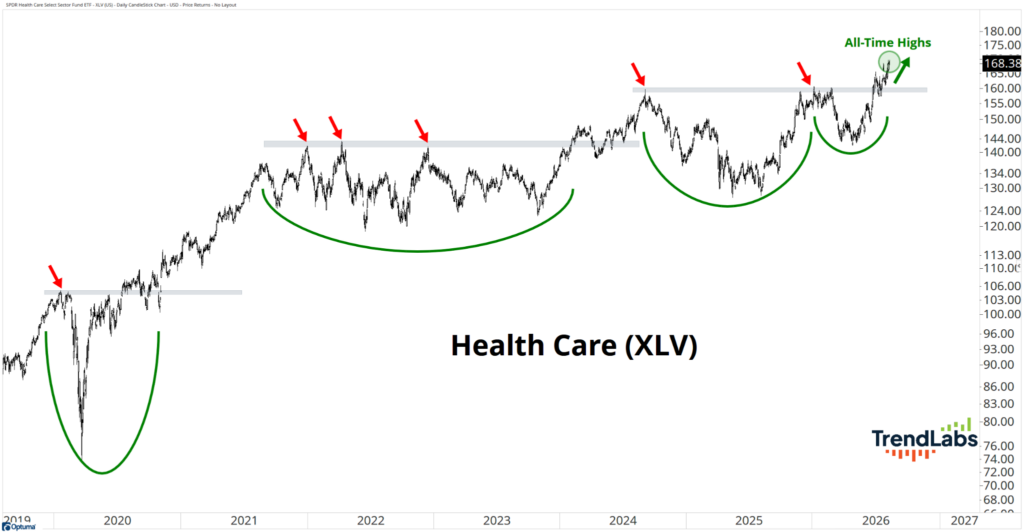
That area around 160 had stopped several advances. Buyers finally pushed through it, and Healthcare is now trading at all-time highs.
The longer-term chart gives that breakout more context.
Healthcare has spent much of the past several years working through a series of large bases. The latest developed beneath that resistance before buyers eventually cleared it.
Now, instead of sitting beneath resistance, Healthcare is above it and trading at prices we have never seen before.
That’s very different from simply saying Healthcare has had a good few weeks.
The Alpha Score has been telling us the sector is strong. Price is now confirming that leadership with a breakout to all-time highs.
Forget the Label. Watch the Money.
Healthcare is usually thrown into the defensive bucket.
Investors tend to think about it alongside slower growth, falling risk appetite and money looking for somewhere safer to hide.
Sometimes that description is useful, but it can also stop us from seeing what’s happening in front of us.
I’m less interested in what Healthcare is supposed to represent and more interested in how it’s actually behaving.
Right now, it’s near the top of our Alpha Score sector rankings and breaking out to all-time highs.
Money is choosing Healthcare.
That doesn’t tell us why investors are doing it, and I don’t think we need to invent a reason. Price doesn’t require a story before we’re allowed to pay attention.
The next question is whether this strength is spreading underneath the sector.
The Strength Goes Deeper Than the Index
A sector can sometimes look healthy because a small number of its largest companies are doing most of the work.
That’s why I like to look at breadth:
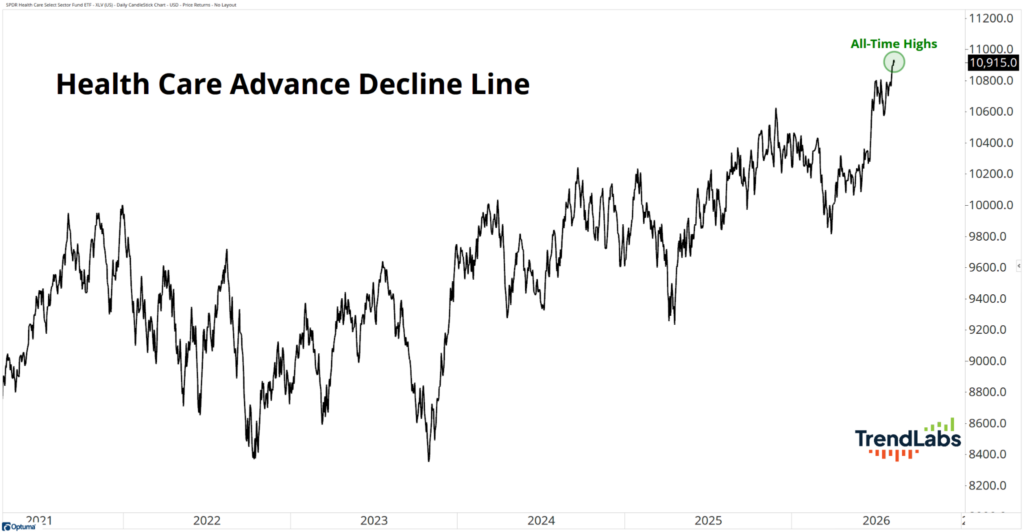
The Healthcare advance-decline line has now moved to an all-time high.
This measures the cumulative difference between the number of Healthcare stocks advancing each day and the number declining.
When it is rising alongside the sector itself, participation is expanding rather than becoming increasingly dependent on a small group of stocks.
That’s what we are seeing now.
Healthcare is making all-time highs, and the advance-decline line is doing the same thing.
Now we have several readings pointing in the same direction. Price is breaking out, participation is broad, and Healthcare continues to rank among the strongest sectors we track.
That gives me much more confidence in the quality of the leadership than the breakout would on its own.
The Part Most Investors May Be Missing
Technology still dominates the conversation.
AI, semiconductors, and the biggest growth stocks remain where most investors instinctively look when they think about market leadership.
And there’s nothing wrong with that if the evidence supports it.
But it can also create a blind spot.
When everybody’s staring at the same part of the market, quieter leadership can develop somewhere else without attracting much attention.
That’s one reason I like the Alpha Score.
It doesn’t care which sector is fashionable or which one gets the most airtime. It applies the same Trend, Relative Strength, and Momentum framework to all 11 sectors and lets the rankings show us where leadership is actually developing.
For six straight weeks, Healthcare has kept appearing near the top.
Then price broke out.
Then breadth confirmed it.
At some point, you have to stop calling that noise.
What We Do With the Readings
Healthcare has done enough to remain near the top of our focus.
We don’t need to predict how long this leadership lasts or assume it will still be sitting near the top six weeks from now.
We need to recognise what the market is doing today and allow that evidence to influence where we spend our time.
That is what the Alpha Score was built to help us do.
Rather than starting with a story and trying to justify it, the Alpha Score starts with the evidence.
Trend, Relative Strength and Momentum tell us whether the move is healthy today.
Right now, Healthcare keeps passing that test.
As long as it continues to rank well, price holds its breakout and participation remains healthy underneath the surface, it deserves our attention.
If those readings begin to change, our view changes with them.
Which brings me back to where I started.
Last week, eight vials of blood gave me more than 50 different readings and a baseline for the next 120 days.
I don’t know what those readings will look like when I test them again, and that’s exactly why I’m measuring them.
I’m not trying to predict the result. I’m trying to improve the inputs, measure what changes, and adjust from there.
The Alpha Score works in much the same way.
It gives us an objective read on Trend, Relative Strength, and Momentum today, then forces us to keep checking whether that evidence is improving or deteriorating.
Right now, Healthcare keeps passing that test.
Most investors may still be looking somewhere else.
We don’t have to be.
The whole point of having a process is to see leadership developing before the story becomes obvious.
Happy hitting🏌️⛳
Grant Hawkridge
Quantitative Analyst, TrendLabs