
Everybody wants to talk about gold like it’s some brand-new phenomenon.
As if markets have never gone completely insane and then immediately destroyed everyone who showed up late to the party.
But gold has done this movie before.
And the chart from the 1970s is impossible to ignore right now.
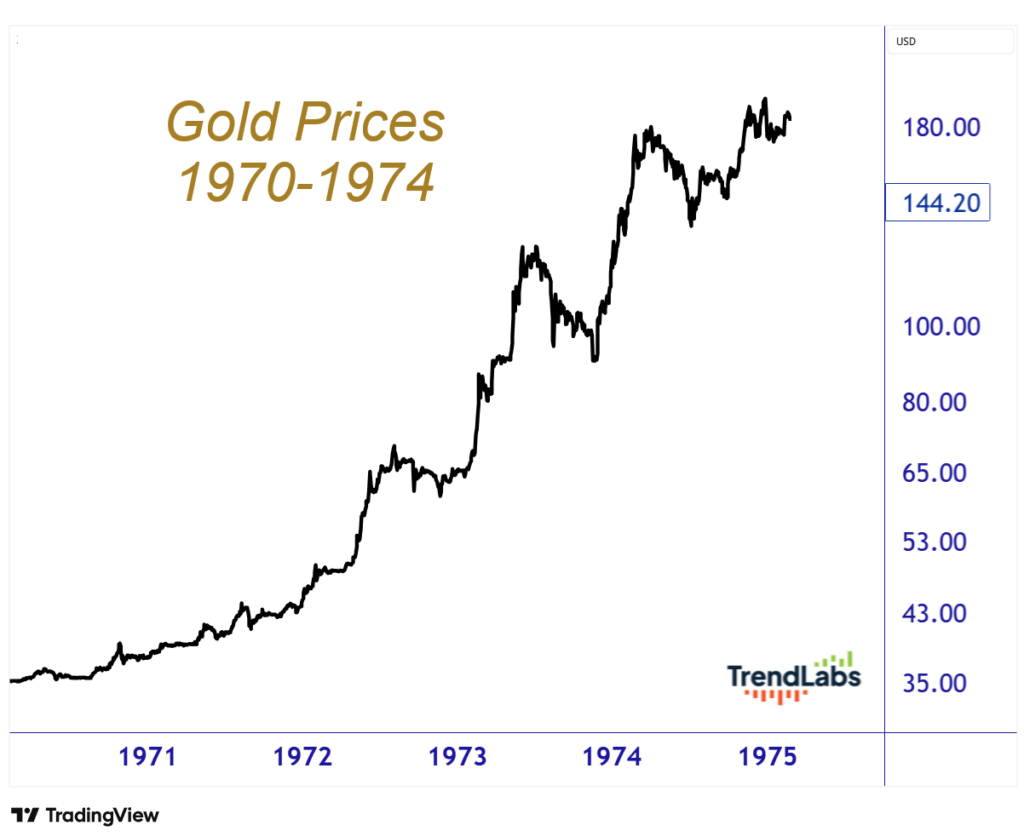
Back then, gold spent the early part of the decade absolutely exploding higher after the United States officially broke from the gold standard. Inflation was ripping. Oil prices were surging. Confidence in government and central banks was deteriorating.
Sound familiar yet?
Gold went from roughly $35 an ounce in the early ’70s to almost $200 by the end of 1974:
Then came the part nobody remembers.
Gold got absolutely destroyed.
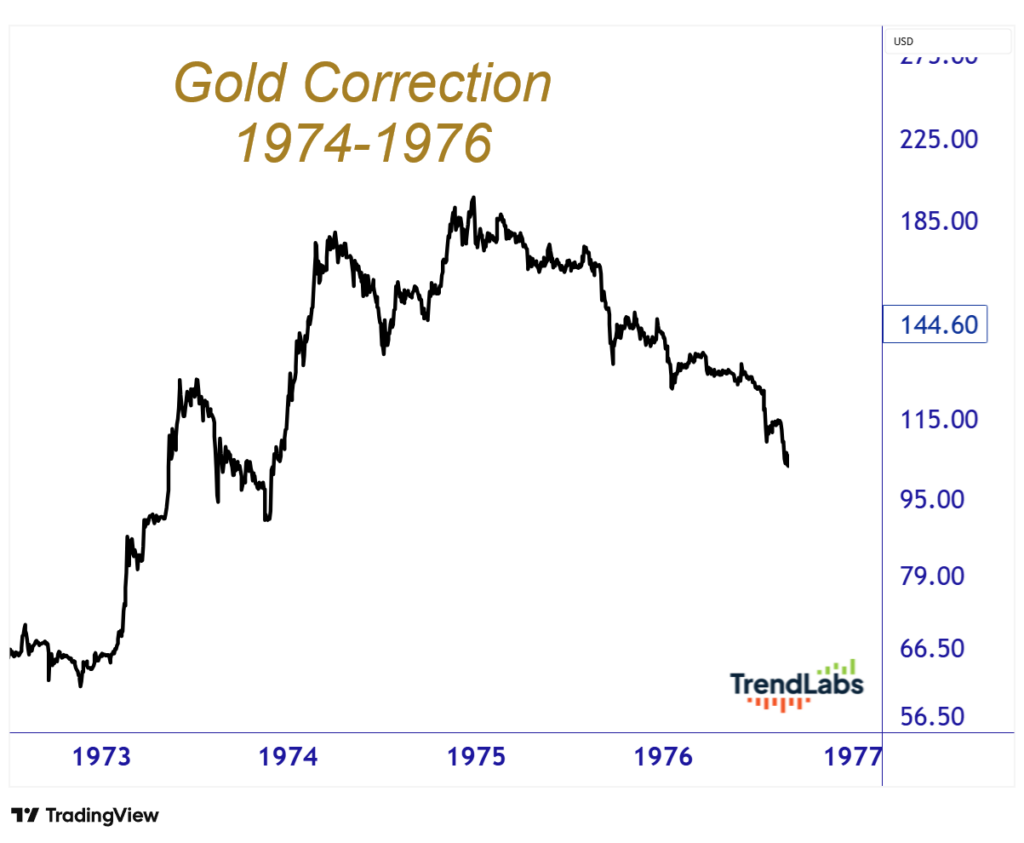
From the December 1974 peak near $195, gold collapsed all the way to roughly $100 by August 1976. That was about a 47% to 48% correction depending on the data source you use.
Almost half.
And it took roughly 20 months for the correction to finally finish.
Now think about how people talk about gold today.
Every day I hear someone explain why gold can never go down because deficits, because inflation, because central banks, because geopolitics, because fiat currency, because the end of civilization.
Maybe.
But markets don’t move in straight lines forever. Not even the strongest secular bull markets.
Especially not the strongest secular bull markets.
The Part Everyone Forgets About the 1970s
The 1974 peak was not the end of the gold bull market.
Not even close. It was basically halftime.
That brutal correction into 1976 turned out to be the setup for one of the most violent upside moves in market history.
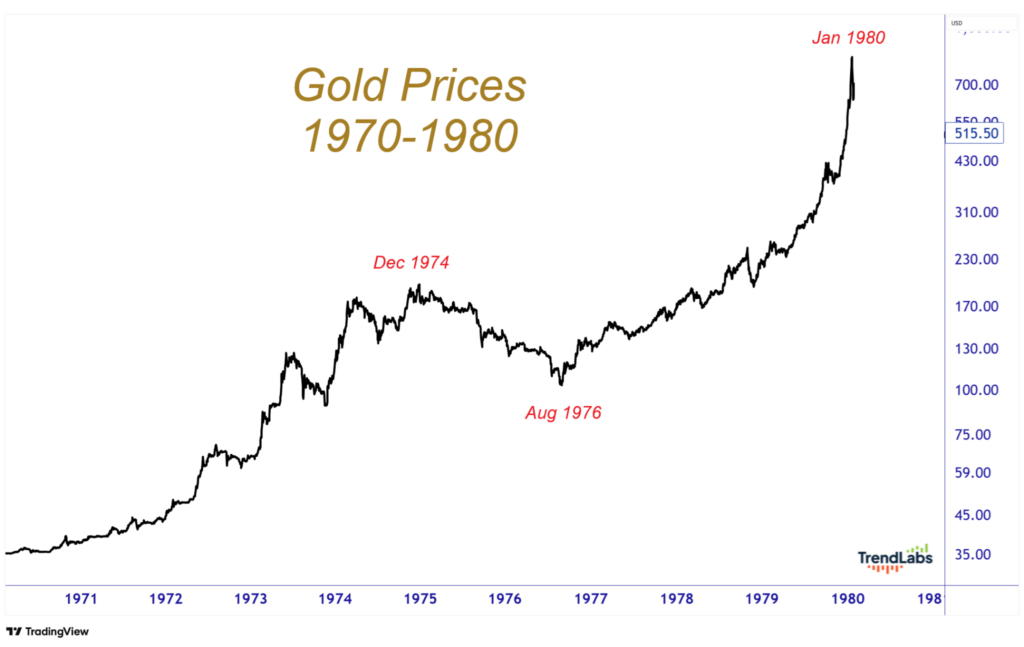
After bottoming near $100 in August 1976, gold went completely vertical into the 1980 peak near $850.
Think about that for a second. Gold fell almost 50%.
Then it went up roughly 750% over the next three and a half years:
That’s why studying market history matters.
Not because history repeats exactly. It never does. But because human behavior repeats constantly.
The emotional cycle is always the same.
First people don’t believe the move. Then they accept it. Then they worship it. Then they panic during the correction.
Then the real move starts.
That’s the part I think people are struggling with right now.
Because if this really is rhyming with the mid-1970s, then the current correction in gold might not be the end of anything.
It might just be the annoying middle part that frustrates everybody before the next major leg higher begins.
What Would “Exactly Like the 1970s” Mean?
This is where it gets fun.
Let’s just pretend for a second the roadmap matches almost perfectly. Not because I think it will. But because it’s useful to think through the possibilities.
If gold were to correct roughly 47% to 48% like it did from 1974 into 1976, and if we use the recent January highs around $5300 as the equivalent peak, then you’re talking about downside into roughly the $2750 area before the correction fully runs its course.
And if the timing matched, too, meaning roughly a 20-month correction phase, then you’re potentially looking at a major low sometime in September 2027.
Would that feel horrible in the moment?
Of course it would. That’s the point. The 1976 low didn’t feel bullish, either. It felt like failure. It felt like the whole thesis was wrong.
It felt like gold was dead.
Then it went berserk.
And this is the part that should really get your attention.
If gold followed the same magnitude move off the eventual low that it did from 1976 into 1980, then you’re talking about a multi-thousand-dollar move from the eventual bottom.
A 750% rally off an $2750-ish low would imply something north of $23,000 gold sometime around the end of this decade.
Again, I’m not predicting that.
Please don’t go mortgage your house because you read a blog post.
I’m simply showing you what the historical analogy would imply if this cycle really does rhyme with that one.
And honestly, whether the number ends up being $10,000 or $15,000 or $20,000 isn’t even the point.
The point is that secular commodity bull markets are violent.
Both directions.
That’s how they work.
The people who survive them are the ones who understand that corrections are a feature of strong trends, not necessarily evidence that the trend is over.
Sometimes they’re the setup for the best part.
And if this really is 1974 all over again, then maybe the scary part isn’t the correction.
Maybe the scary part is what comes after it.
Stay sharp,
JC Parets, CMT
Founder, TrendLabs