
Editor’s Note: Hey, just a quick note.
First, empathy. It is a nice place to be, not having a lot of positions right now.
But plenty of investors out there do have a lot of positions and a lot of exposure to this market, especially in technology stocks, and you may have other portfolios with plenty of technology exposure, too.
Those are the big names that a lot of investors own, and a lot of people are feeling it right now. This is not a time to pound your chest. This is a time to show empathy and understand that others might be having a harder time than you.
What we’ve been doing is a lot less. Over the last couple of months, in both The Divergence portfolio and The Primary Trend portfolio, we’ve either taken profits on a bunch of stocks or gotten stopped out.
Because of that, we’re insulated from a lot of the damage that’s been done under the surface.
And what are we doing now? The same things we have been doing. Being patient and letting the market dictate our actions.
On Wednesday, I said there was a high likelihood we would put on four or five trades very soon. We were just waiting for the trigger. The market had other intentions, those trades never triggered, and so we never put them on.
Next week is a new week. Maybe we get that momentum trigger and put on three, four, five trades in a day, maybe the most we’ve ever put on, in either portfolio.
I thought that could’ve happened this week. It did not.
There’s a reason patience pays. Let the market tell us when to make big moves.
I think it’s soon. We’ll see. – JC
The S&P 500 has joined small caps and the Nasdaq 100 below its 200-day moving average.
In my October 10 note, I explained why I was still approaching the market from the bullish side. The S&P 500 was making new highs and holding above its rising 200-day average.
I wasn’t going to bet against that simply because the uptrend had been around for a while.
But I also said I would adjust if the evidence changed.
Now take a look at these three charts:
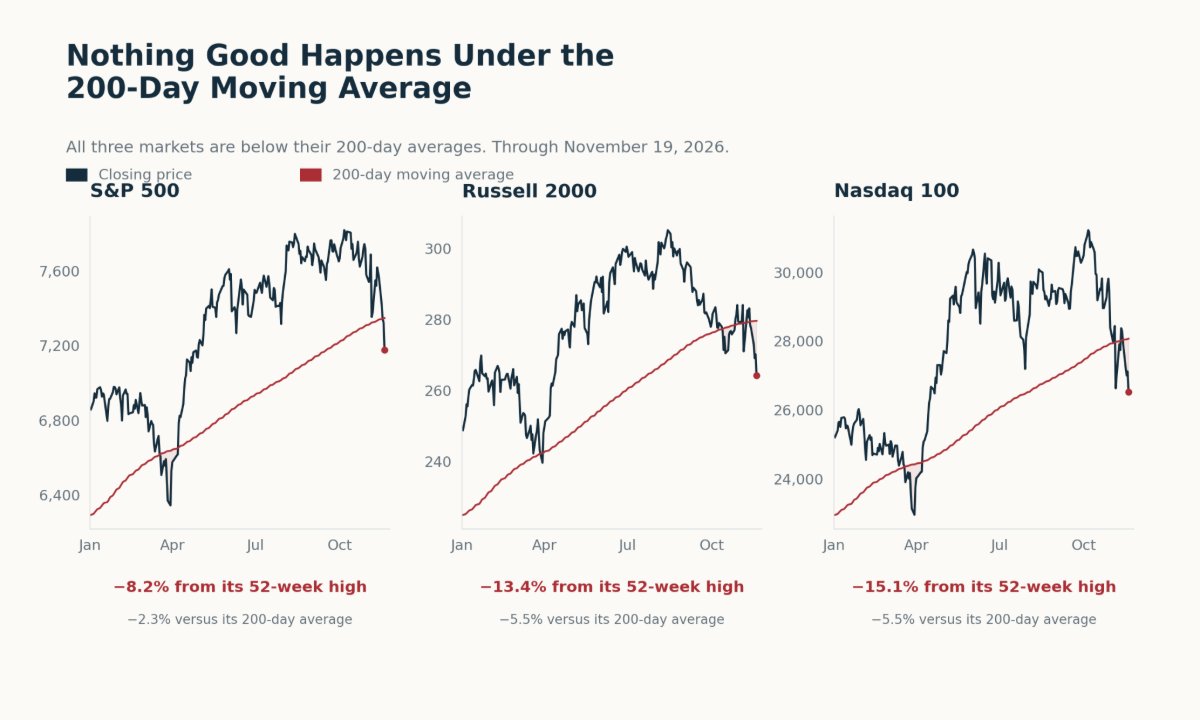
All three are underneath their 200-day moving averages.
That brings me back to a line I use when thinking about risk.
“Nothing good happens under the 200-day moving average.”
This week, I went back through the data to put some numbers behind it.
I wanted to know how long markets stayed below the average, how much more volatile trading became and how far prices fell.
Where Are We Now?
The 200-day moving average is simply the average closing price over the previous 200 trading sessions.
I use it as a reference for the longer-term trend. When price falls below it, I become more cautious about putting money to work.
Here’s where the three markets stood through Thursday’s close:
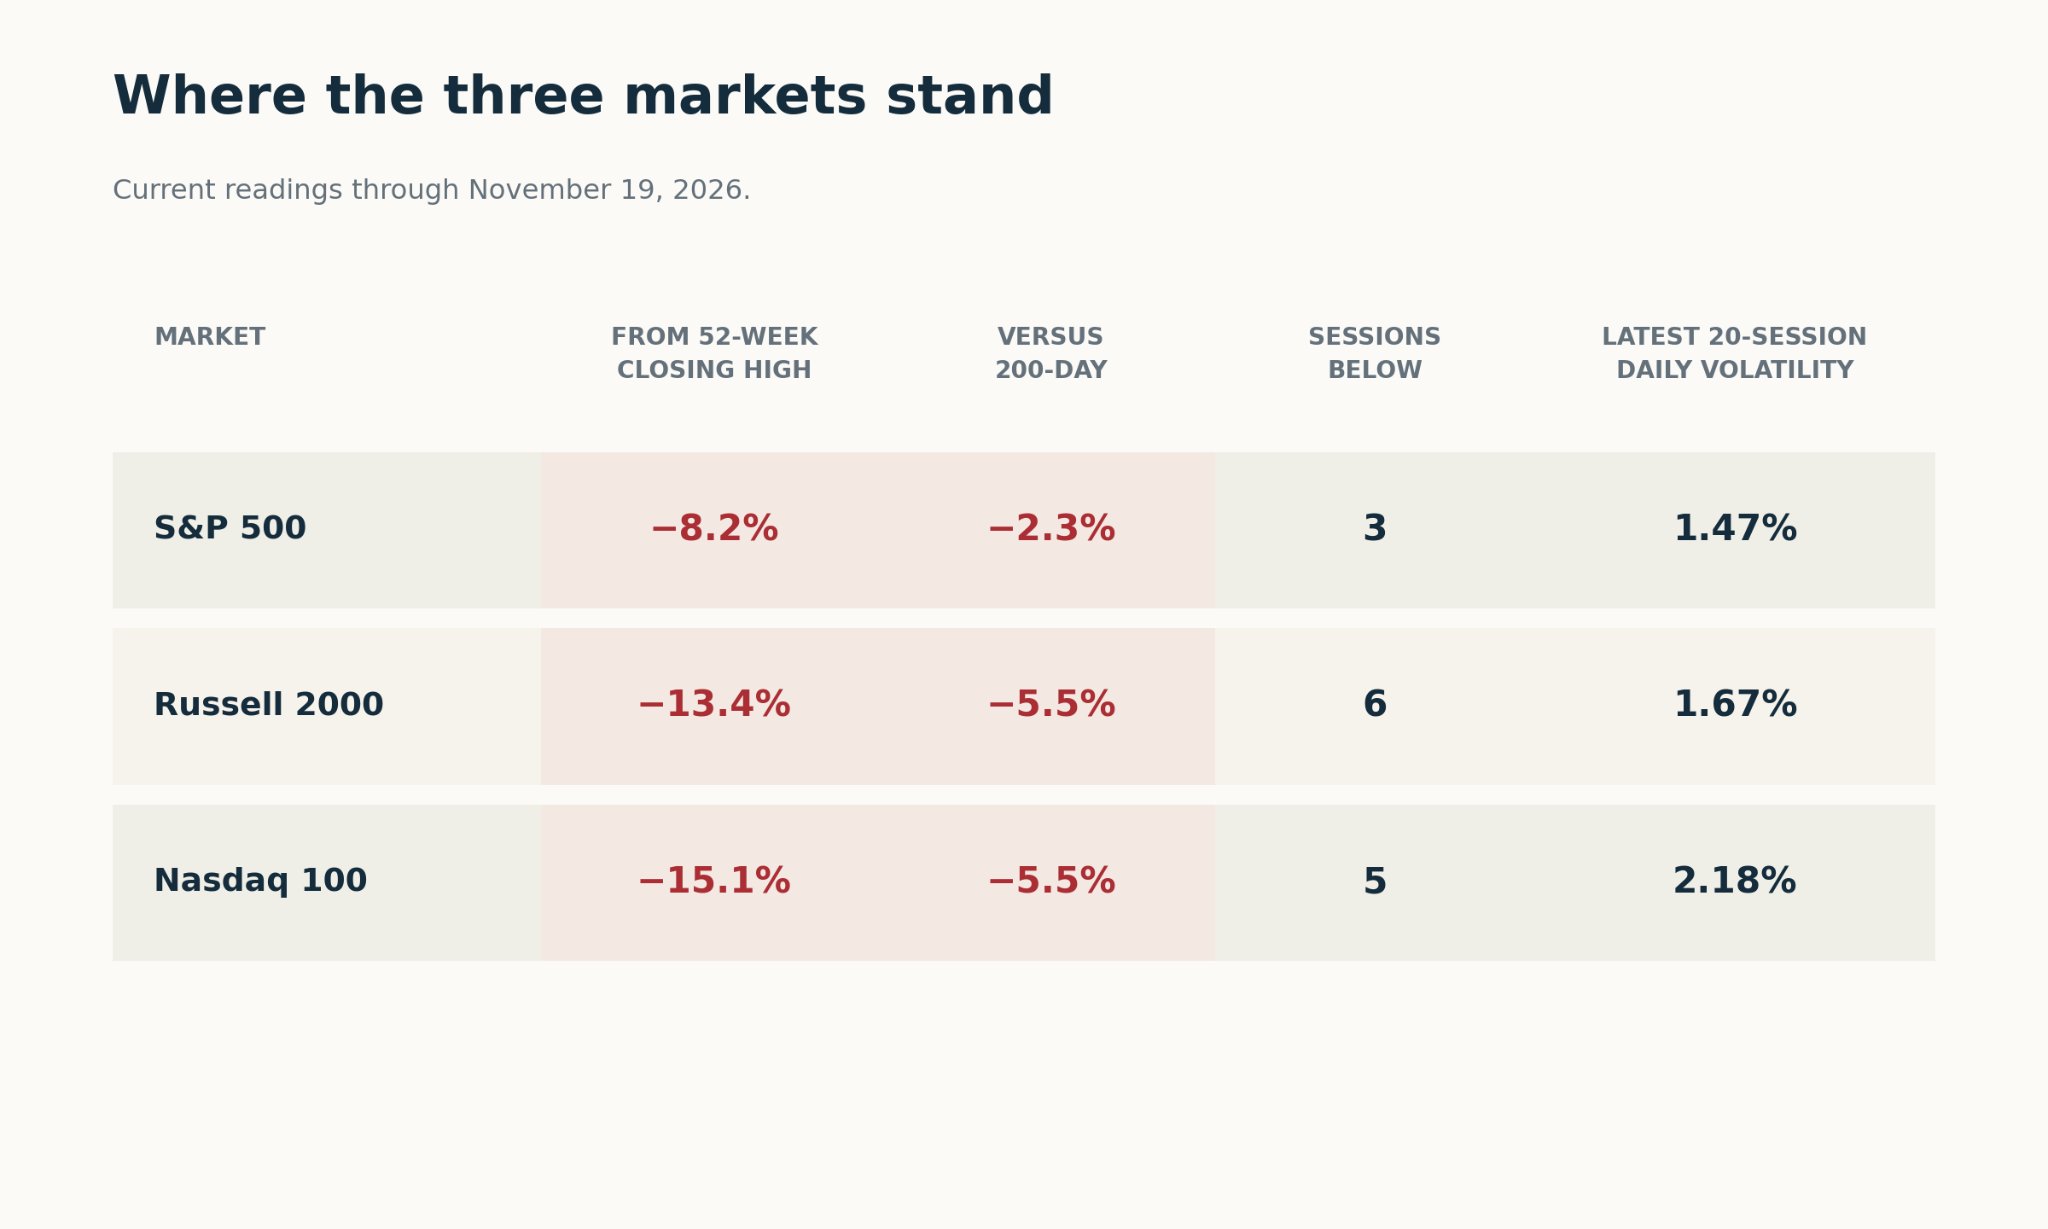
Small caps were 13.4% below their 52-week closing high. The Nasdaq 100 was down 15.1%.
The S&P 500 had held up better, with an 8.2% decline. But it had now lost its own 200-day average, too.
That’s why I want to keep looking beyond the S&P 500. A smaller decline in one index can make the market feel better than the other charts look.
Right now, all three are below their averages.
How Long Can Markets Stay Underneath?
I started by counting each completed stretch of consecutive closes below the average.
The count began at the first close below and ended when price got back to the average or above it.
I used each market’s own available history.
Here’s how the current stretches compare with the historical averages:
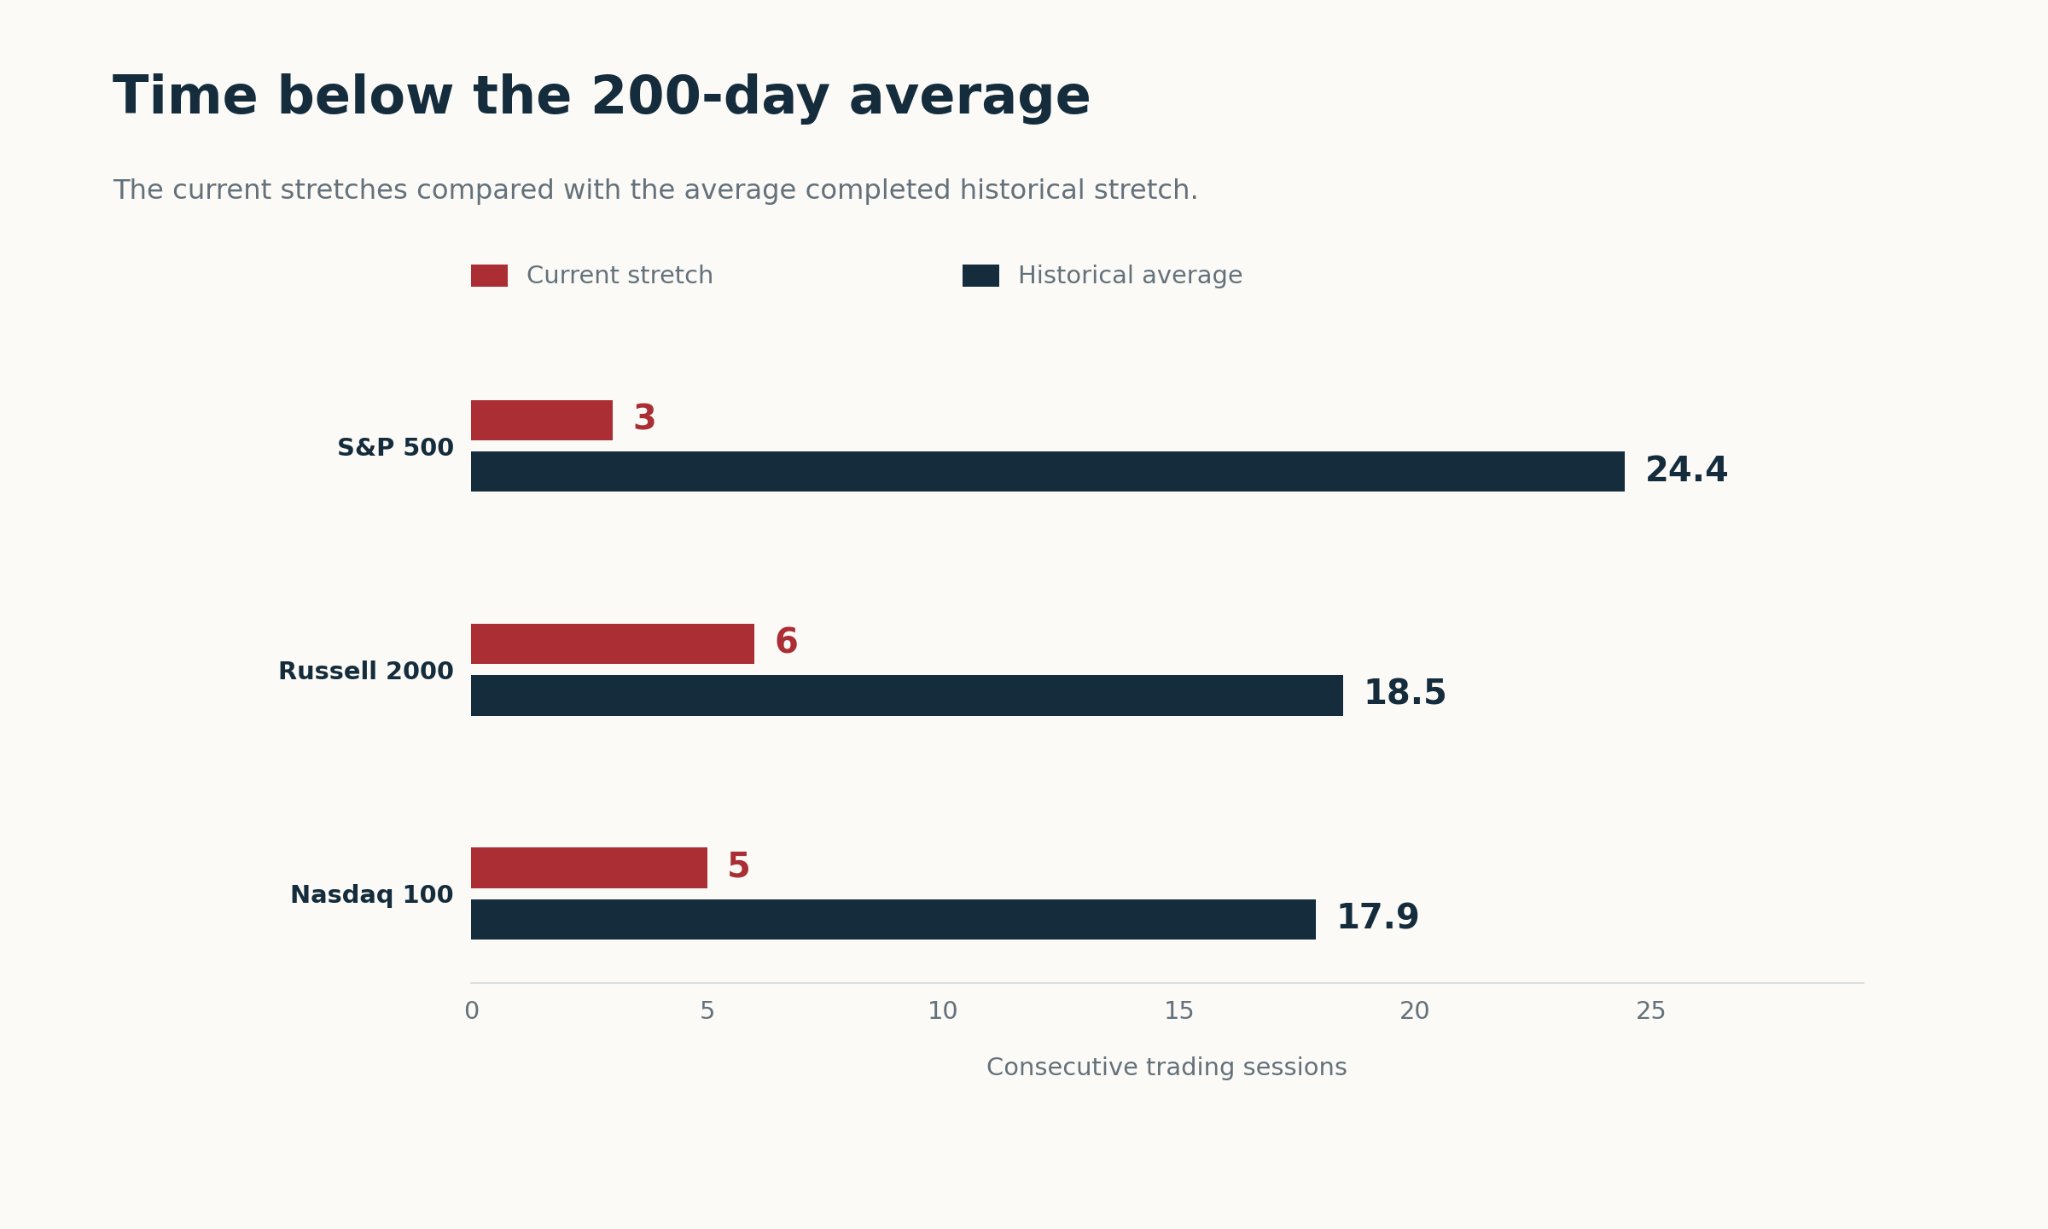
The S&P 500 had spent three sessions underneath through Thursday. Previous completed stretches averaged 24.4 sessions.
Small caps had been below for six sessions, compared with an average of 18.5. The Nasdaq 100 had been below for five, compared with 17.9.
Roughly a month of trading, on average.
But look at how long some of these periods lasted.
The longest completed stretch was 359 trading sessions for the S&P 500, 207 for small caps, and 301 for the Nasdaq 100.
For the S&P 500 and Nasdaq 100, that was more than a trading year.
Some breaks recovered quickly. The longer episodes pulled those averages higher. So I can’t take the average and use it to put a recovery date on the calendar.
I can use it to remind myself that getting back above the average can take time.
The Daily Swings Get Bigger
Time is one part of the experience. What happens to your account while you’re waiting is another.
So I compared daily volatility above and below the 200-day average. Volatility measures how widely daily returns swing around their average.
Then I added the latest 20-session reading:
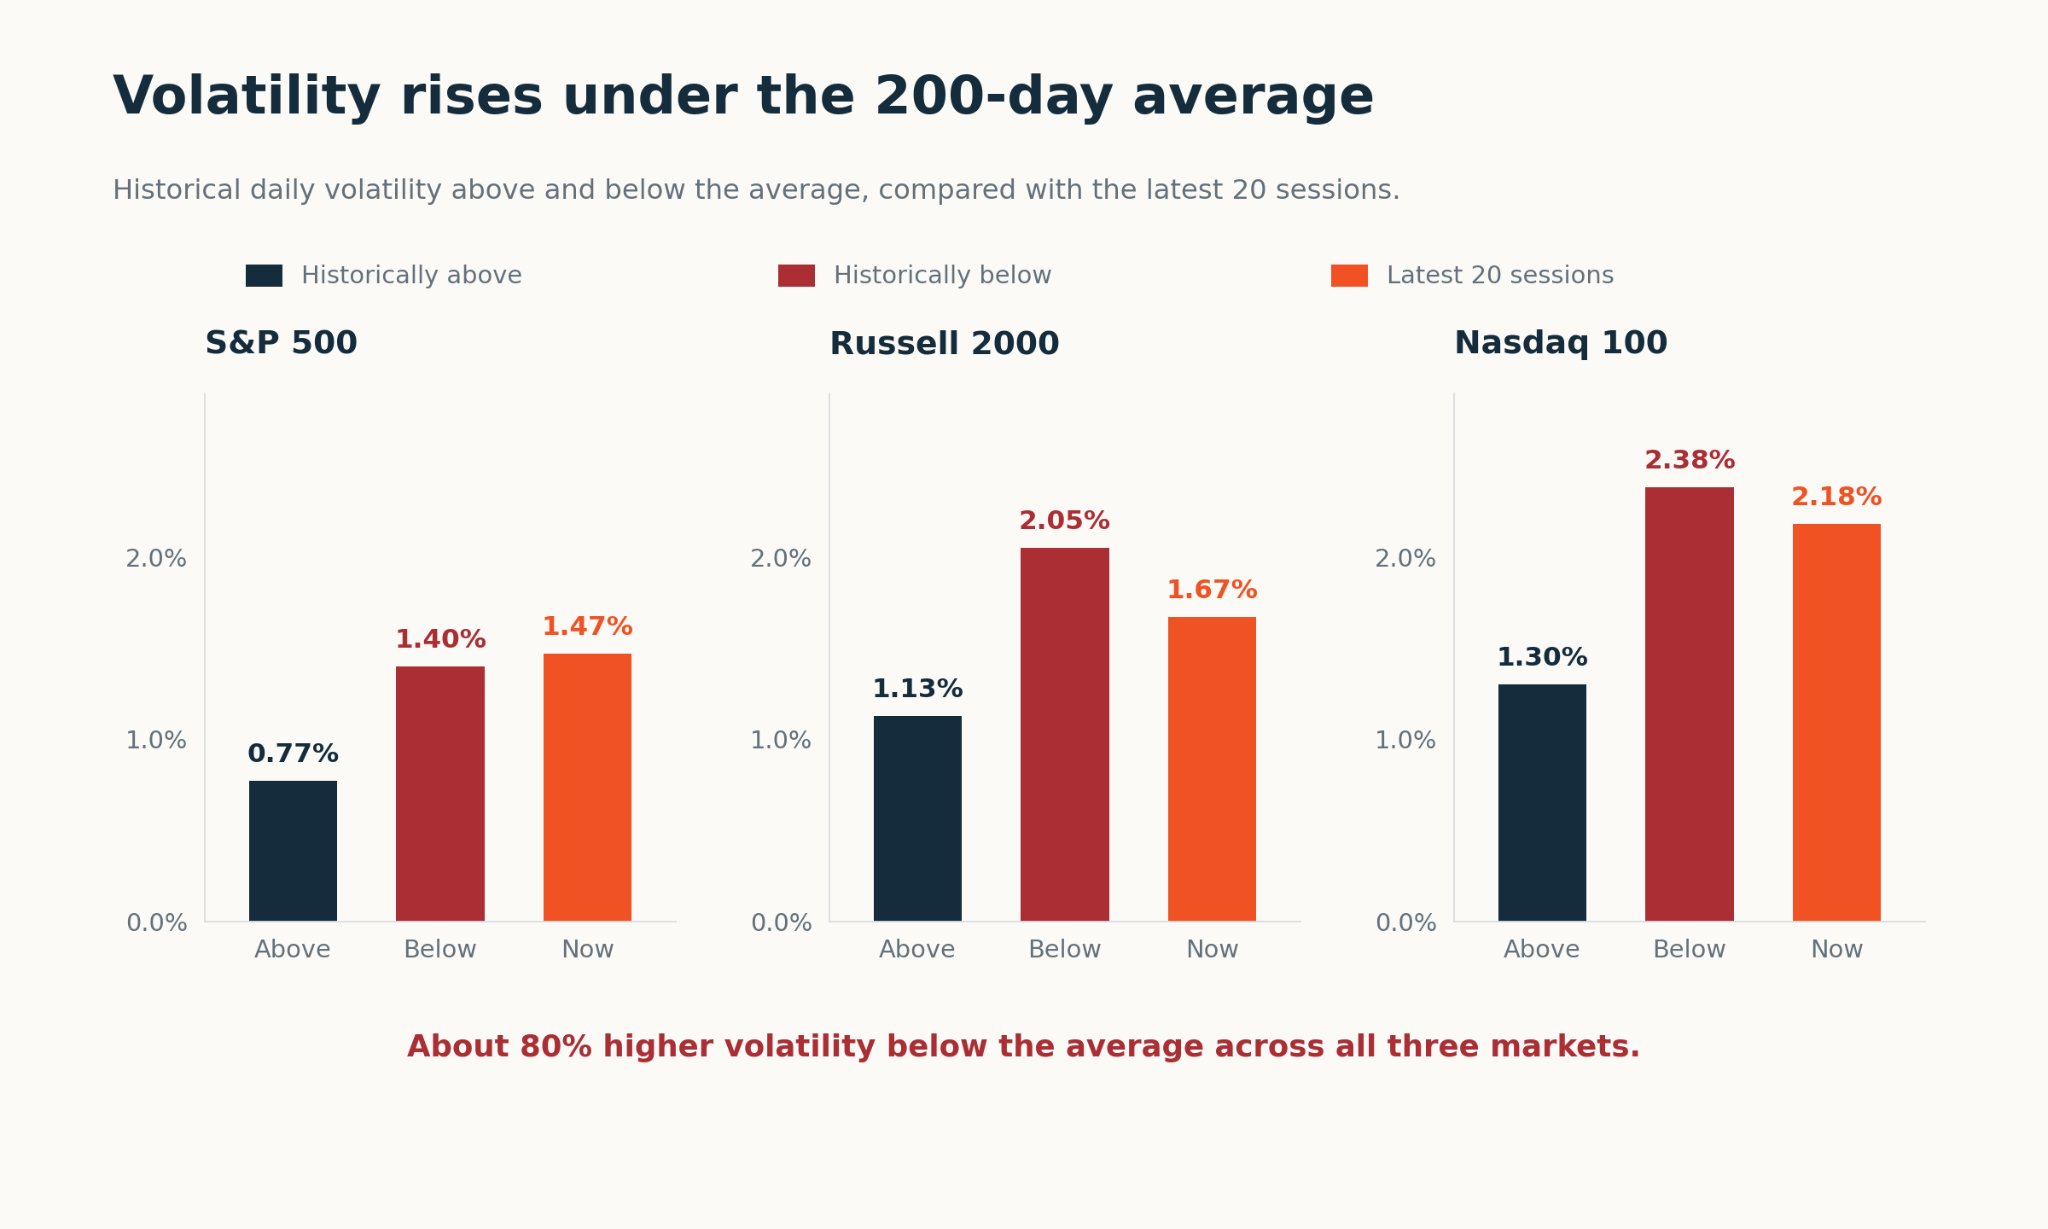
Start with the navy and red bars.
Historical volatility was about 80% higher below the average across all three markets.
Three different markets. Three different histories.
A very similar increase in volatility.
Now look at the orange bars, which show the latest 20 sessions.
All three readings are higher than their historical readings above the average. The S&P 500’s latest reading is already slightly above its historical figure below the average.
That helps explain why holding a position can start to feel very different.
The amount you own hasn’t changed, but the price is swinging around more.
If you were already uncomfortable with the risk, bigger daily swings aren’t going to make waiting for a recovery any easier.
How Much Have Prices Fallen?
Next, I looked at the total decline.
For each historical break, I took the highest closing price over the preceding 252 sessions. Then, I measured the fall to the lowest close before price regained its 200-day average.
That includes the selling before the break.
Here’s how those completed declines compare with where we are today:
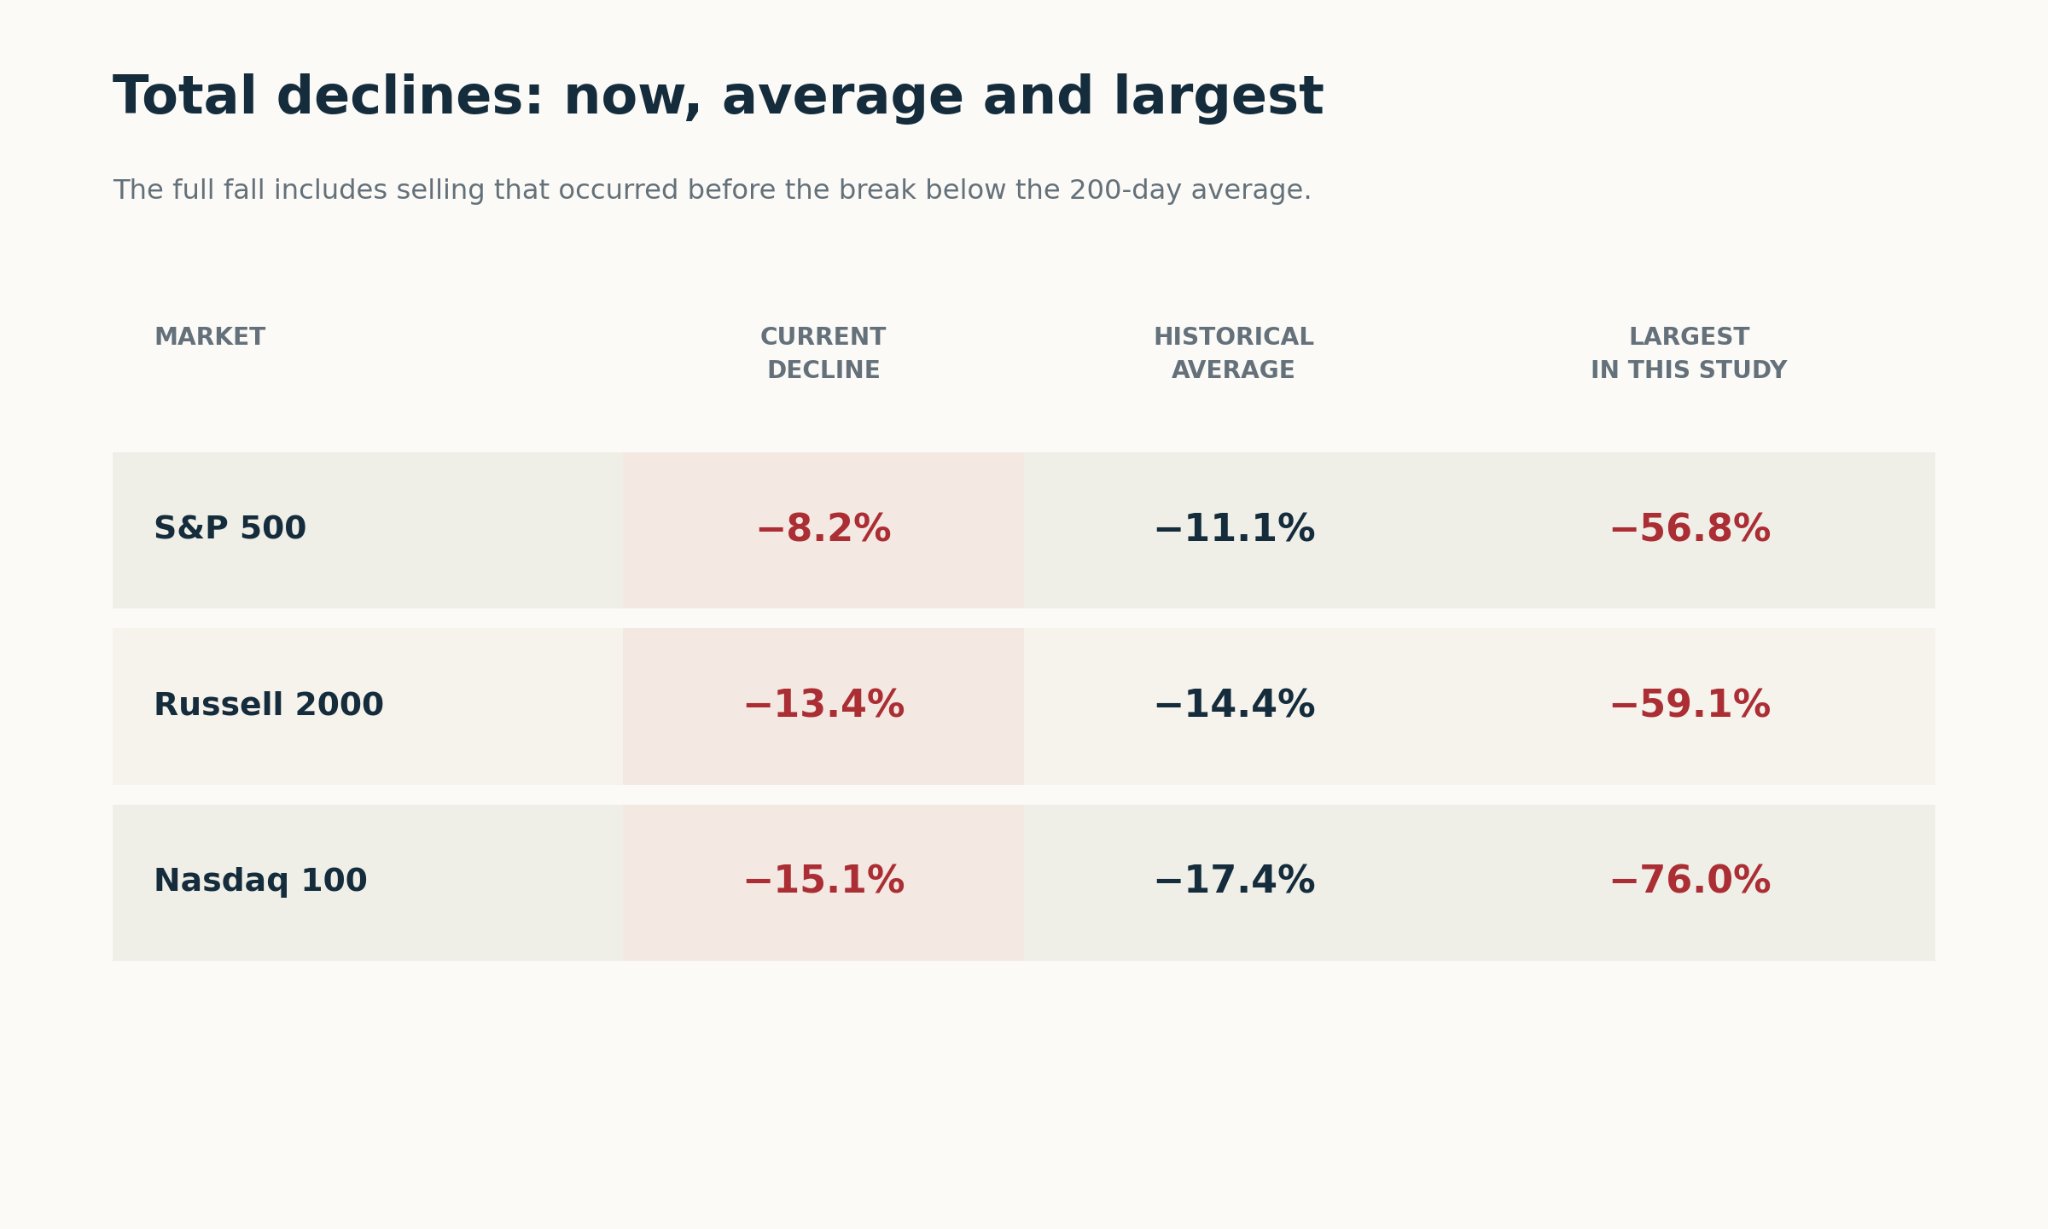
The average total decline was 11.1% for the S&P 500, 14.4% for small caps and 17.4% for the Nasdaq 100.
All three current declines are smaller than those historical averages.
Small caps and the Nasdaq 100 have already suffered double-digit falls, though, so plenty of damage has been done.
Getting close to an average doesn’t give me a reason to call the bottom.
Look at the largest declines in the final column. Those came during 2007–09 for the S&P 500 and small caps, and 2000–01 for the Nasdaq 100.
They were exceptional periods. I include them because an average alone can hide how different the individual experiences were.
Some periods were manageable. Others involved very large losses.
That range is something I want to understand before deciding how much risk I’m comfortable taking.
So What Am I Doing With It?
In my last Saturday note, I said I wanted to see buyers come back the day after a rally.
I still want that follow-through. Now they also have these longer-term averages to reclaim.
The next chart puts all three markets on the same percentage scale. Zero means price is sitting on its own 200-day average.
Above zero, it’s back above the average:
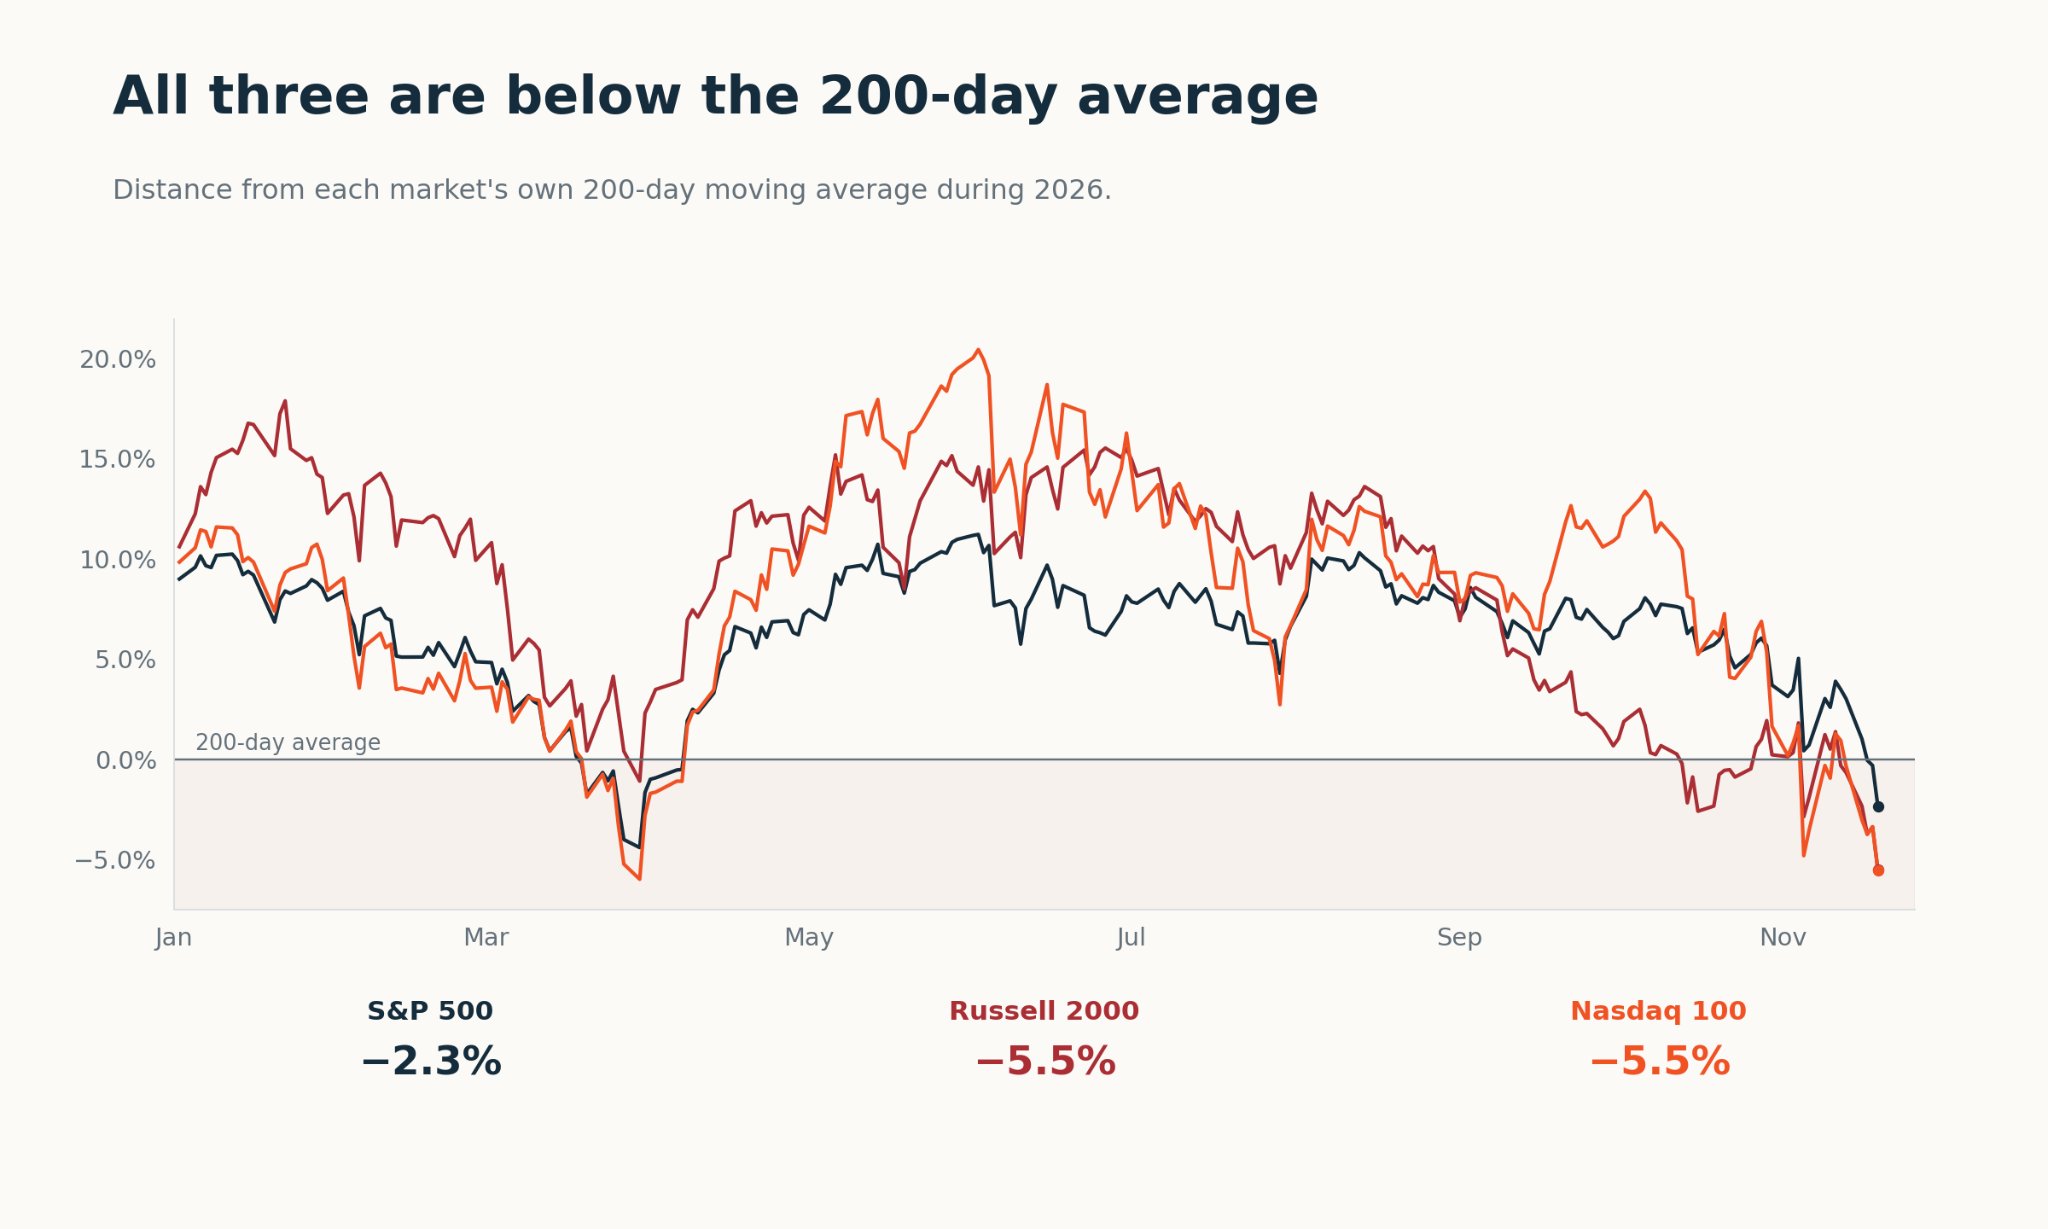
The S&P 500 is closest, at 2.3% below its average. Small caps and the Nasdaq 100 are both around 5.5% below.
Those lines give me something concrete to watch when buyers return.
Can they get price back above them? Can they keep it there?
If they can, I’ll have better evidence to work with before becoming more aggressive.
If the markets keep falling while those gaps widen, I’ll have another reason to remain cautious.
I don’t need to know today how long this decline will last or where the low will be. I can keep following price and adjust as the evidence changes.
For now, buyers have three 200-day moving averages to reclaim.
I want to see them get back above those lines and stay there before I put more money to work.
Happy hitting🏌️⛳
Grant Hawkridge
Quantitative Analyst, Everybody’s Wrong