
My friend Jack Thatcher and I were talking markets this week.
Jack’s a trader down in Florida, and he brought up something that I thought was worth sharing with you guys.
What are the three most important charts in the world right now?
It’s not Nvidia (NVDA), and it’s not Bitcoin. It’s not the S&P 500, either.
We’re talking about home construction, banks, and transportation stocks.
Now, none of this should come as a surprise. We’ve been talking about these areas for years, certainly a lot more recently.
But Jack did a great job bringing them all together, and I wanted to piggyback on that conversation.
So shoutout to Jack for inspiring today’s post.
The reason these three charts matter so much is that they’re all sitting at important levels.
And what happens next could tell us a lot about where the stock market is heading into the end of the year and, more importantly, into 2027.
Let’s start with housing.
When interest rates rise, borrowing money gets more expensive. That’s not particularly helpful when you’re trying to convince someone to buy a new house.
Home construction stocks have been getting hit lately, and on Monday they closed at new 52-week lows.
That’s not exactly what you want to see heading into what’s supposed to be one of the strongest times of the year for stocks.
But here’s where things get interesting.
Home construction is now back near an important area where buyers have shown up before.
This was an old ceiling that prices struggled to get through. Once they finally broke above it, that same area became a potential floor.
Think about it like a house.
First you have to break through the ceiling. Once you’re upstairs, that old ceiling is now the floor you’re standing on.
That’s what we call polarity in technical analysis. Old resistance becomes new support.
Right now, that floor is being tested:
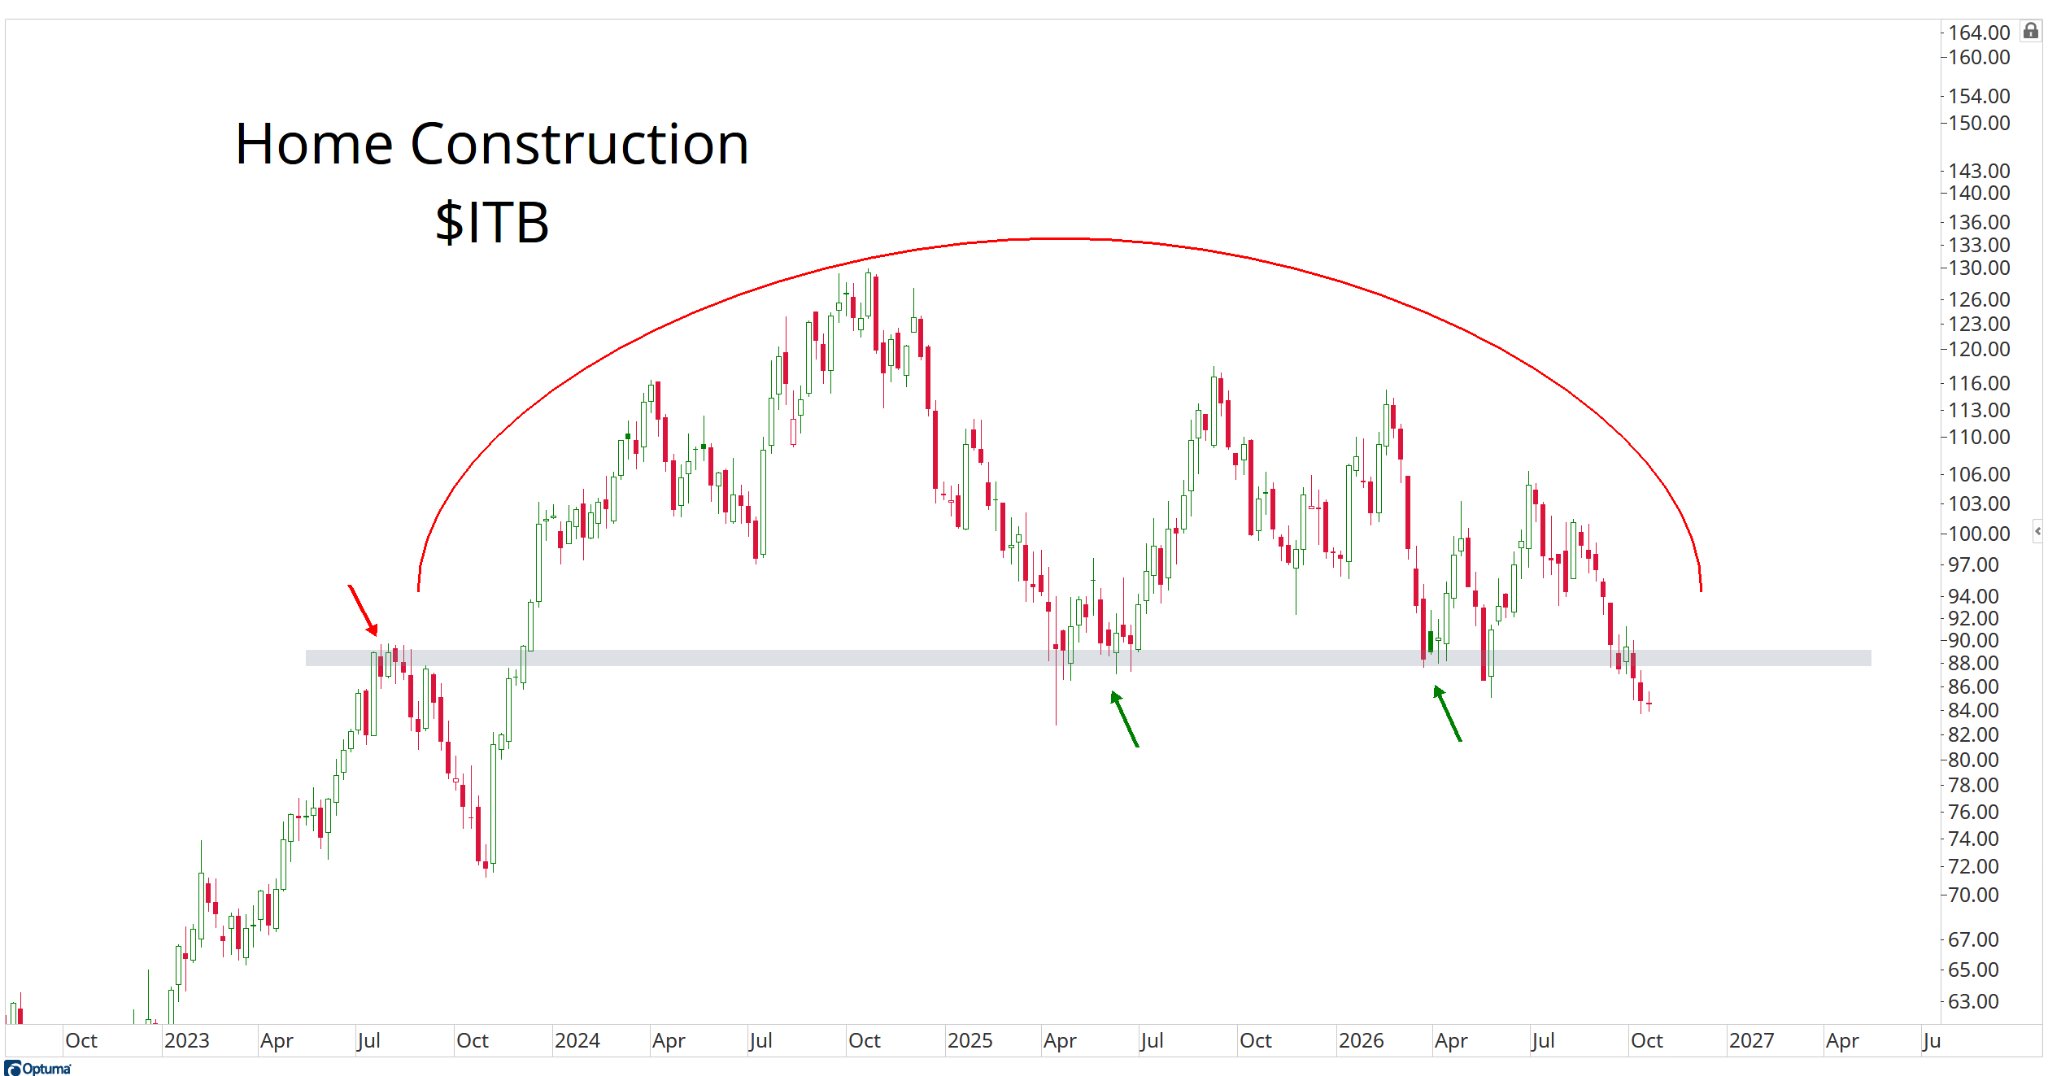
If buyers show up here, that’s encouraging. If the floor gives way, that becomes a problem.
And it’s not just a problem for people who own home construction stocks.
Housing touches a whole lot of the economy. When people build houses, they buy lumber, appliances, furniture, windows, and all kinds of other stuff.
When home construction is struggling, we need to pay attention.
You Don’t Get Bull Markets Without Banks
I’ve been saying this for as long as I can remember.
We don’t have bull markets without banks.
Banks are the plumbing of the economy. They’re involved when people borrow money to buy homes, when businesses need financing to expand, and when consumers use credit to buy things.
When bank stocks are doing well, that’s generally a good sign.
And the chart of the S&P Bank Index has been telling us a pretty incredible story.
Remember the Great Financial Crisis back in 2008?
Bank stocks got absolutely destroyed. It took years for the industry to recover, and the old highs from before that disaster became a massive ceiling.
Well, the banks finally broke through that ceiling:
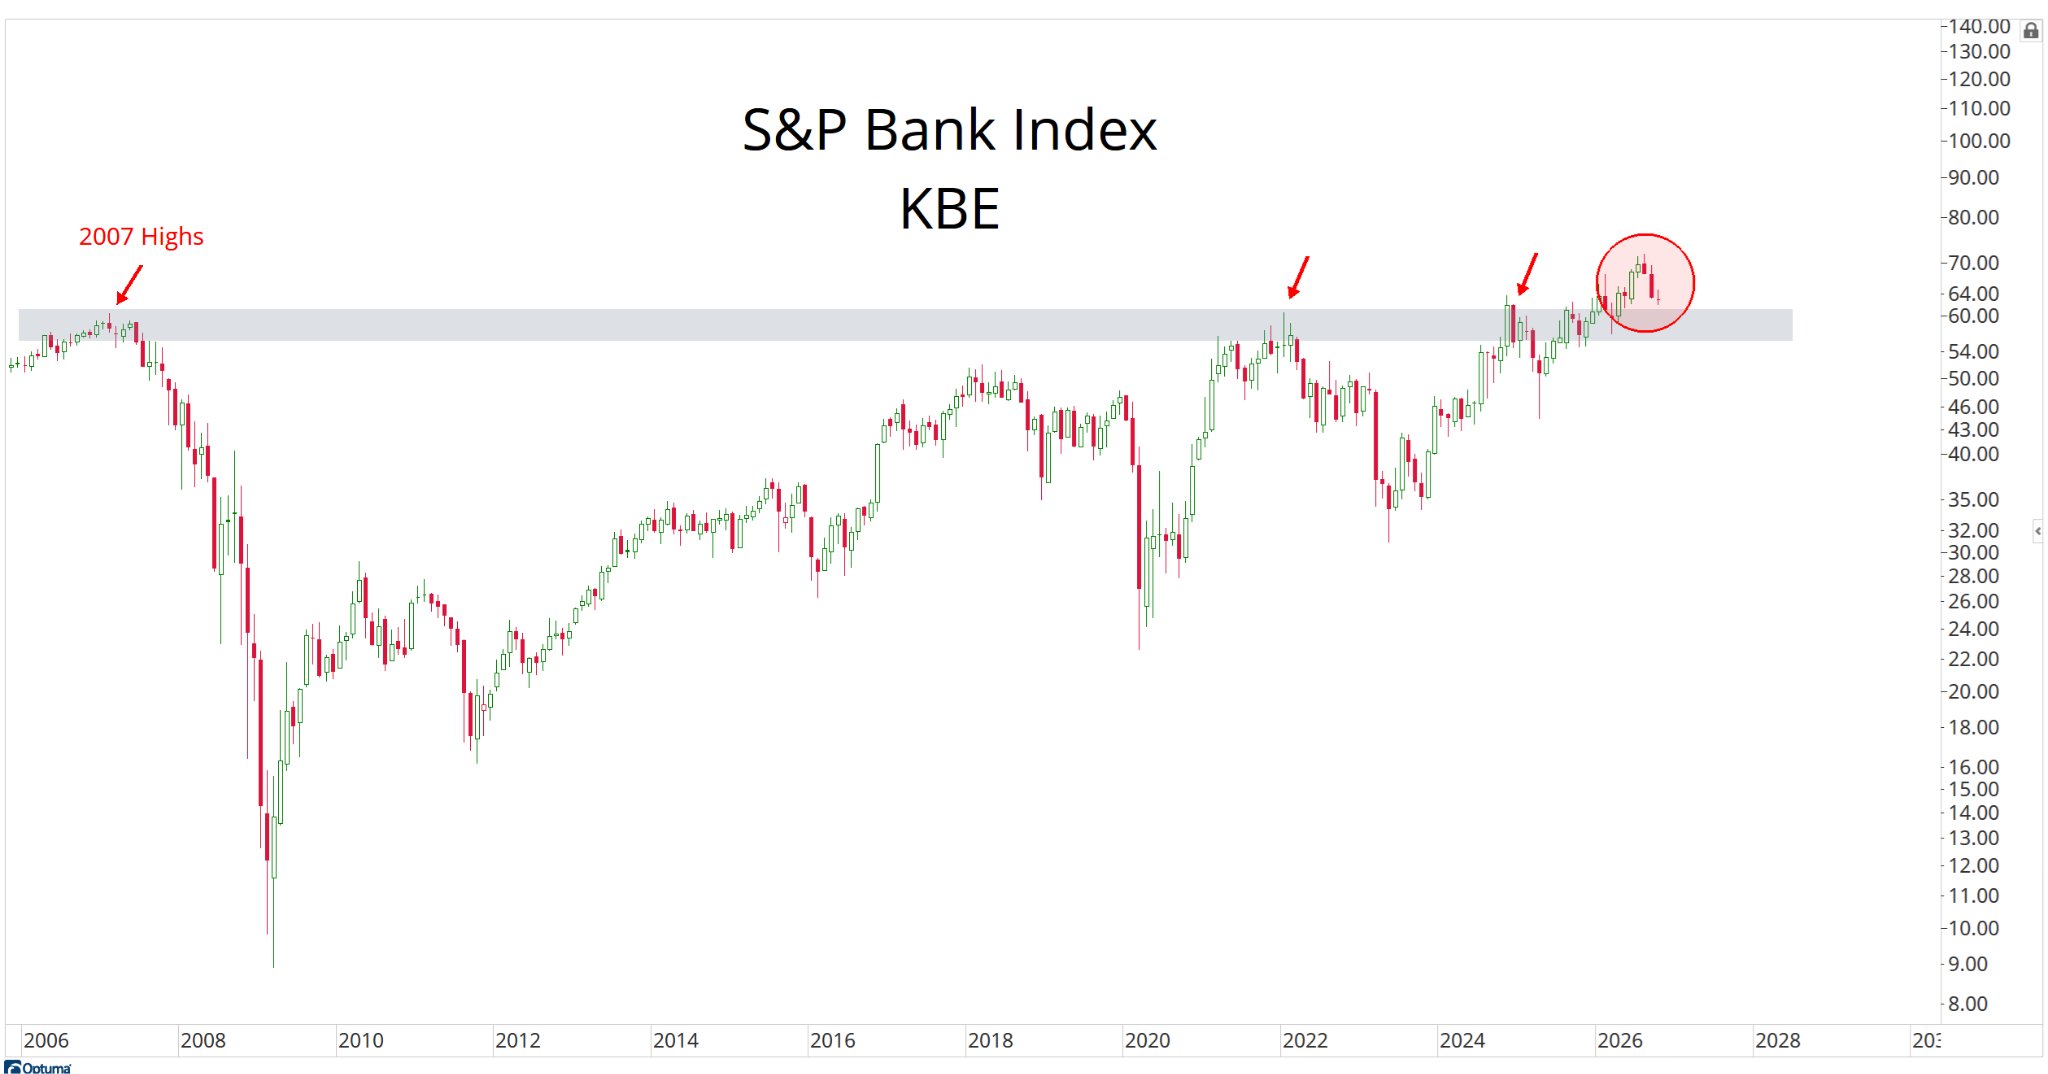
That’s a monster development.
We’re talking about a breakout above levels that had been holding these stocks back for nearly two decades.
But here’s the catch.
A breakout is only a breakout if prices can stay above the old highs.
If banks hold above those pre-financial-crisis highs and buyers come back in, that’s exactly what the bulls want to see.
But what happens if they fall back below?
Now we’re right back inside that giant trading range that trapped bank stocks for all those years.
That’s not good.
Imagine finally escaping from prison after almost 20 years, only to turn around and walk right back into your cell.
That’s basically what a failed breakout in banks would look like.
And if the banks are doing that while home construction is breaking down, I’m going to have a hard time getting excited about the prospects for the overall stock market.
Which brings us to the third chart.
Somebody Has To Deliver the Stuff
One of the oldest ideas in stock market history is that the companies making things and the companies delivering those things should generally be doing well together.
Makes sense, right?
If factories are producing more goods, somebody has to move them around the country.
Trucks, trains, airplanes, shipping companies. These are the businesses that help keep the economy moving.
This is why we spend so much time comparing the Dow Jones Industrial Average with the Dow Jones Transportation Average.
Today I want to show you something a little different.
We’re looking at the S&P Transportation Index, which gives its transportation stocks equal weight rather than letting the biggest companies dominate the index.
Wouldn’t you know it, we’re right back at another incredibly important level.
Transportation stocks recently broke out to new all-time highs after struggling with the same ceiling for years:
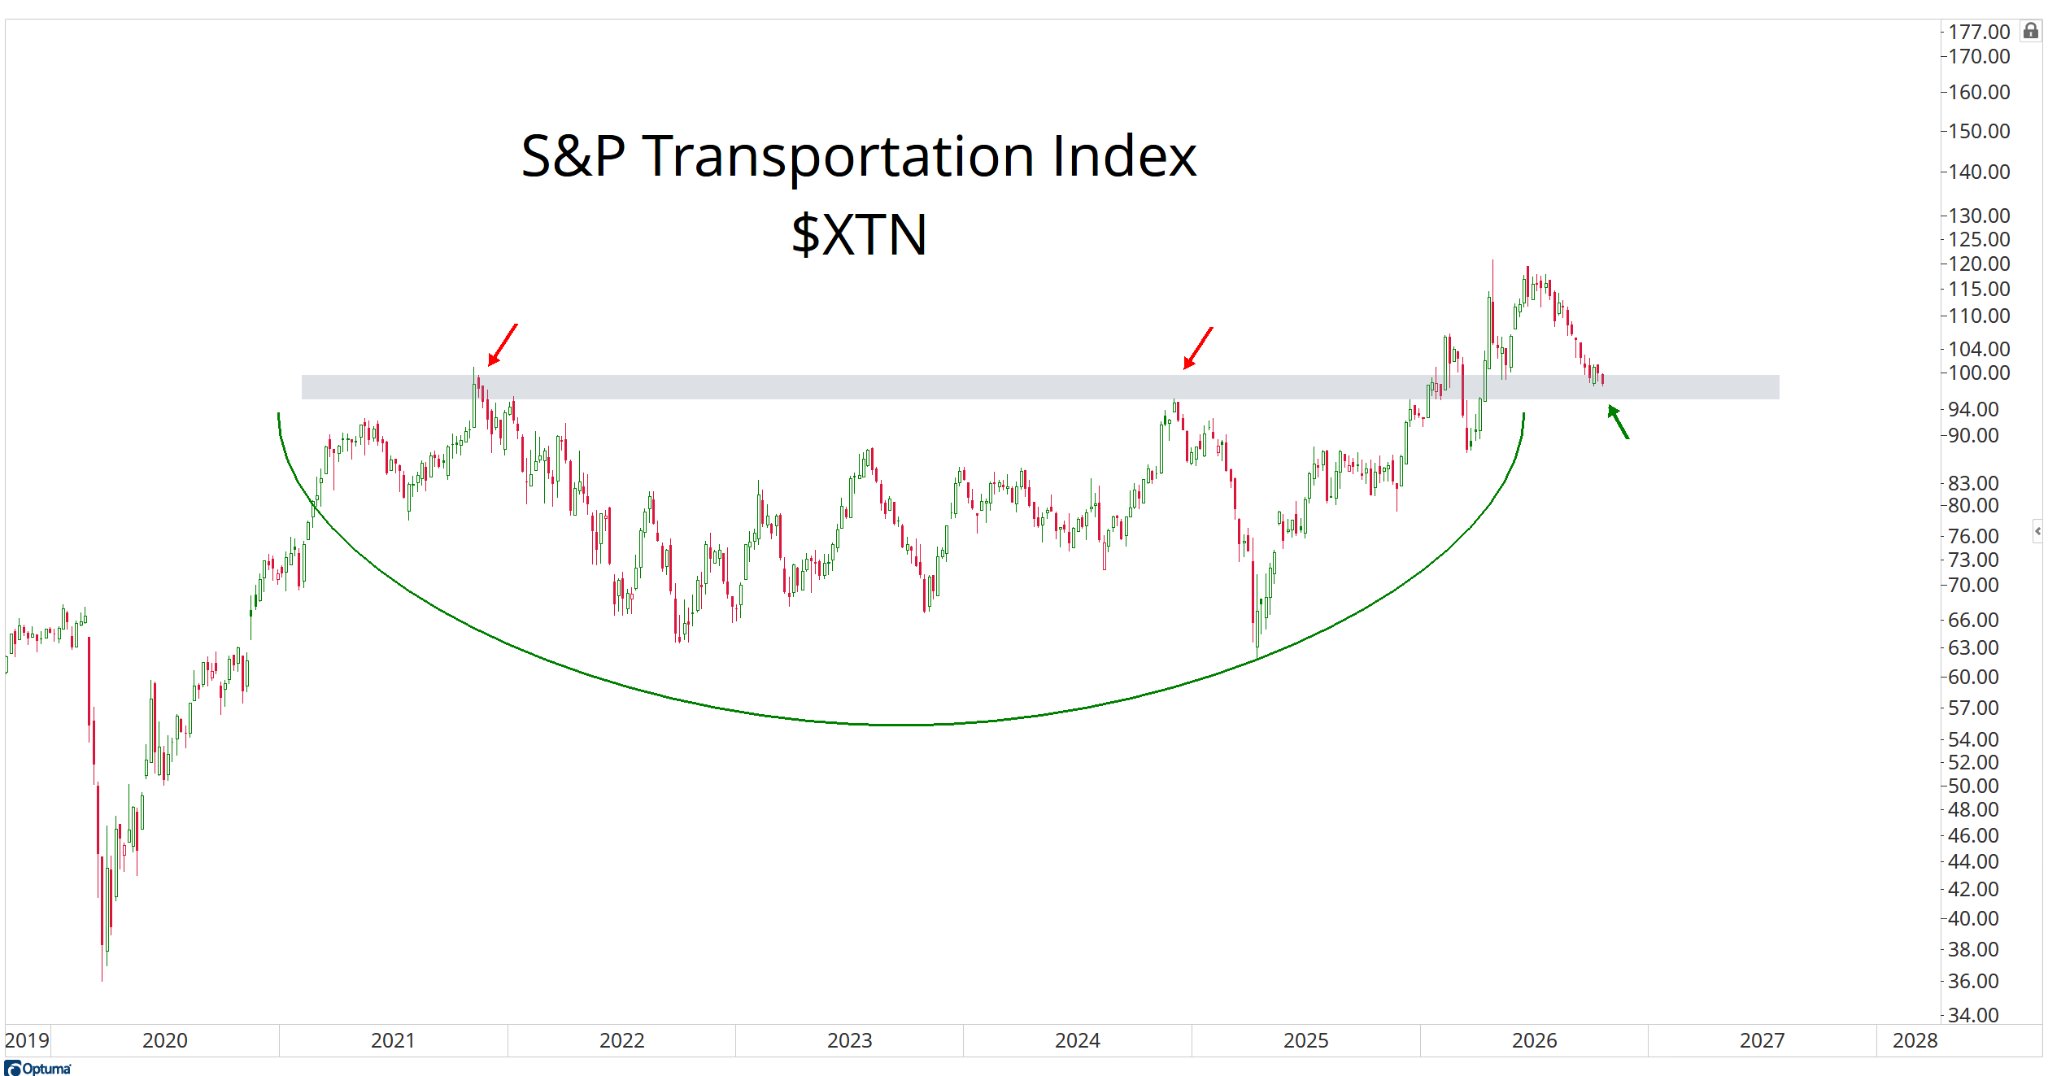
That’s a big deal.
But, just like the banks, they’ve now come back down to test that old ceiling.
Remember our house analogy?
We’re standing on the floor again, and we’d really prefer not to fall through it.
If transportation stocks can hold these levels and start moving higher again, that’s a great sign.
It tells us that investors are still willing to put money into the companies responsible for moving goods around the country.
But if this breakout fails too, now we’ve got a problem.
Home construction is breaking down, banks are falling back into a range they’ve been stuck in for almost 20 years, and transportation stocks can’t hold their historic breakout.
That’s not exactly the recipe for a healthy year-end rally.
Before we wrap up, I want to give Europe an honorable mention.
Take a look at FEZ, which tracks 50 of the largest companies in the eurozone. Think of it as something like the Dow Jones Industrial Average of Europe.
We’re looking at it in U.S. dollars, by the way.
And, wouldn’t you know it, European stocks are also back near their former highs:
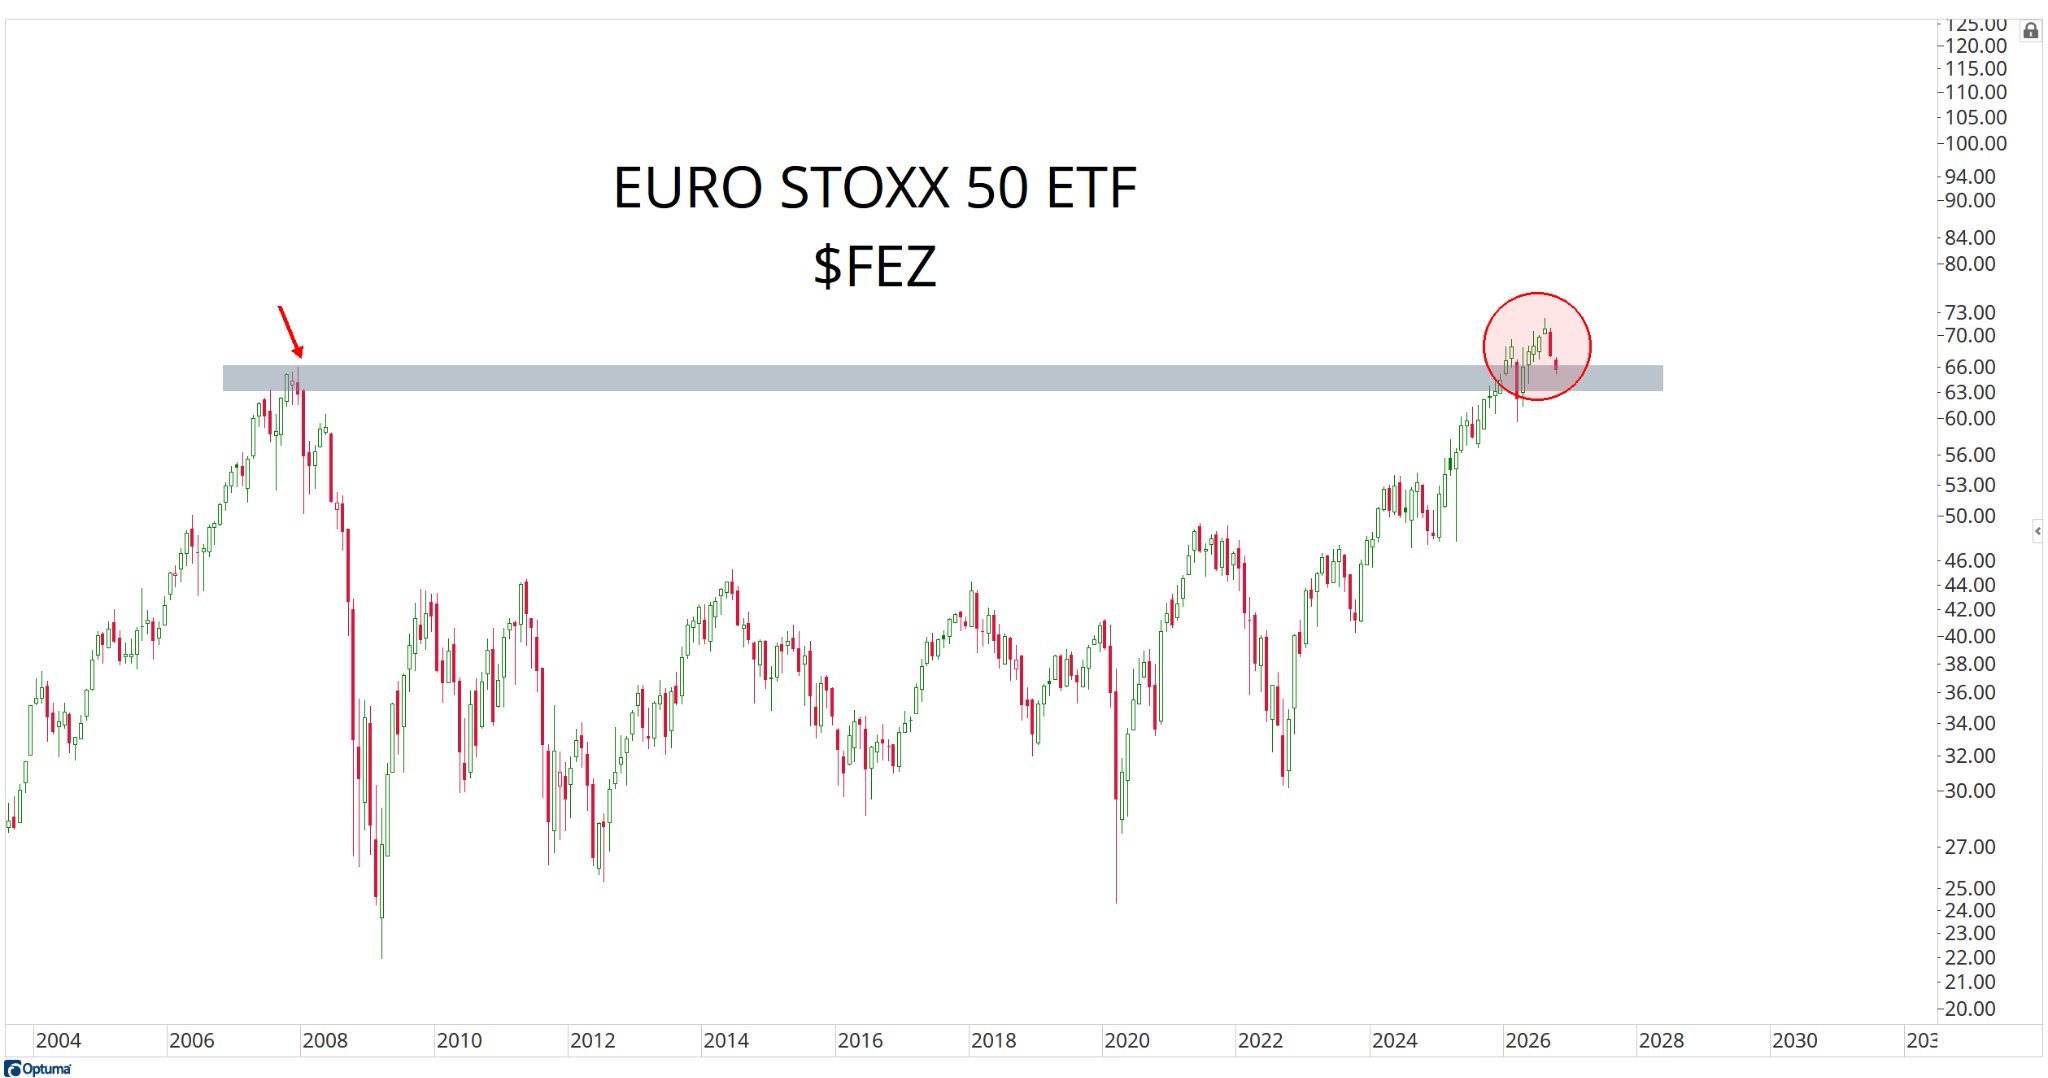
If those old highs hold, great. If they don’t, that’s another failed breakout we need to respect.
Europe has plenty of its own problems. But the chart is telling us something similar to what we’re seeing here in the United States.
Now, here’s why all of this matters.
We’re entering what’s historically been a favorable stretch for stocks.
In fact, the seven-month period beginning around this point in the four-year presidential cycle has historically been the strongest seven-month stretch of that cycle.
If you’re looking for a year-end rally, followed by a strong start to 2027, this would be a perfectly logical place for buyers to show up.
The timing makes sense. The price levels make sense.
And we’ve got three economically important groups sitting right where we’d expect to see demand.
But the market doesn’t owe us anything.
Just because stocks have historically done well during this period doesn’t mean they’re required to do it again.
That’s why we watch the charts instead of just assuming everything’s going to work out.
If home construction, banks, and transportation stocks can all hold these important levels and start moving higher, that would go a long way toward supporting the case for a year-end rally.
But if they all start breaking down together, we’d better pay attention.
And, remember, a weak start to a new year usually sets the tone for what comes next.
So these are my big three right now.
Home construction. Banks. Transportation.
Three different parts of the economy, all testing important levels at the same time.
I don’t think that’s something we should ignore.
If there was ever a logical place for buyers to step up, this is it.
Let’s see if they actually show up.