This is how I get perspective…
Maybe even to a fault. I don’t even know.
Someone I respect a lot told me recently that he doesn’t look at market cap at all. Not even a little.
It almost broke my heart.
Because I do.
And I’m not saying he’s wrong. You can do this a lot of different ways and make a lot of money.
But this the framework I use to approach the world. This is how I stay grounded when things get crazy.
So I’ll show you how I think about it.
You can decide for yourself.
Start With the Big Numbers
If you add up the total value of all the stocks in the U.S. today, it’s about $70 trillion in total market capitalization.
In the late 1990s it was closer to $15 trillion to $20 trillion.
Same country. Same stock market. Completely different scale.
Now we’ve got IPOs coming down the pipeline that could be valued north of $3 trillion.
One of them, SpaceX, is already being talked about at $1.7 trillion on its own.
Add up just three of these names and you’re looking at over $3 trillion in market cap.
That is more than 4% of the entire U.S. stock market concentrated in just a handful of companies that aren’t even public yet.
And if you think that sounds crazy, consider this.
Nvidia (NVDA) just closed the week at new all-time highs and alone is worth over $5 trillion:
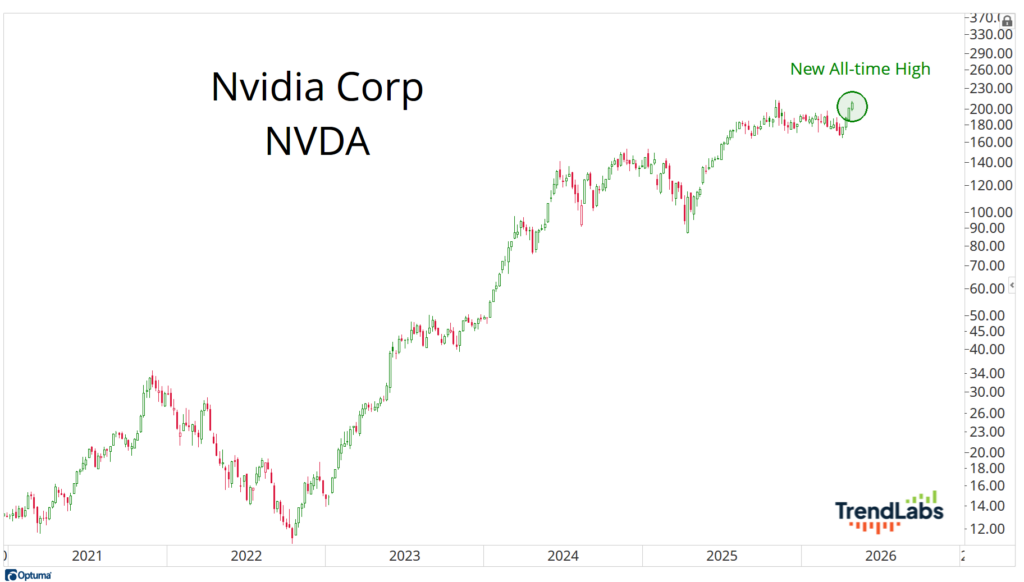
That’s larger than the entire stock market of almost every country on earth.
Bigger than Germany. Bigger than the UK. Bigger than India. Only China and Japan are even in the conversation.
Zoom out again.
The U.S. stock market is bigger than every other country in the world combined.
If you want to understand where the capital is flowing, start there.
Then zoom out even more.
The total global stock market is around $130 trillion.
Gold is about $30 trillion. Silver is roughly $4 trillion to $5 trillion.
Bitcoin is around $1.5 trillion. And all of crypto combined is only about $2.5 trillion.
I’m not even going to get into the bond market, which is in the hundreds of trillions, or the forex market, which operates in the quadrillions and on a scale that’s almost hard to comprehend.
Just know this.
Those markets are much bigger than anything happening in stocks.
Fixed income and currencies move the stock market around whenever they want. Sometimes they toss it around like a rag doll. Stocks don’t lead that dance. They react to it.
So before you start arguing about whether something is “too expensive” or “too cheap,” it’s probably worth asking a more basic question.
What are we even measuring?
Because once you understand the size of these markets, you realize something important.
The price of a stock, by itself, tells you absolutely nothing.
Price Means Nothing
This is where most people get it wrong.
They think a $10 stock is cheap and a $1,000 stock is expensive.
That’s not how this works.
Market cap is price times shares outstanding.
That’s it.
You can have an $8 stock, like Mizhuho Financial (MFG), with billions of shares that’s worth a hundred billion dollars.
And you can have a $500 stock, like Daily Journal Corp (DJCO), with very few shares that’s only worth a few hundred million.
Which one is actually bigger?
Which one takes more money to move?
That’s the game.
Price is just what one share costs. Market cap is what the entire business is worth.
If you’re not making that distinction, you’re not even playing the same sport.
Relative to What?
This is where it all comes together.
I don’t look at market cap in a vacuum. I’m always asking, relative to what?
Relative to other stocks. Relative to other countries. Relative to other asset classes.
You start comparing the largest U.S. companies to the largest companies in other countries and it gets ridiculous fast.
Most countries have entire stock markets smaller than a single U.S. stock.
Not their biggest company. Their whole market.
So when people say something is too big, I want to know what they’re comparing it to.
Too big compared to what?
Because if the U.S. continues to attract capital the way it has, these numbers can keep getting bigger.
A lot bigger.
This is not about telling you what to buy or sell.
This is just perspective.
We have some monster IPOs coming out this year, and I’m just as curious as everyone else how the market is going to absorb all of it.
We haven’t really seen anything like this before. Maybe you go back to the Ford IPO in 1956. Or even RCA incorporation of 1919.
Honestly, the closest comp might be the formation of U.S. Steel in 1901, when it represented about 15% of the entire U.S. stock market.
That was the first billion-dollar company.
Today we’re debating which one gets to $10 trillion first.
That’s the game.
And if you’re not thinking in those terms, you’re probably not seeing the full picture.
This Week in Everybody’s Wrong
On Monday, we observed one of America’s unofficial holidays.
Maybe “420” and smoking pot is bad for us and bad for you.
But owning pot stocks definitely has been way more dangerous.
On Tuesday, we talked about how important it is to have a process.
You’d be amazed how much common ground there is when it comes to analyzing wine and analyzing stocks.
Did you know sommeliers are technicians?
On Wednesday, I told you why I bought one of the worst cryptocurrencies of all time.
I think I can sell it at much higher prices.
The environment is right for this kind of setup.
On Thursday, we broke down the fastest crash everybody missed.
Risk appetite is alive and well, all over the world.
This is now how weak markets behave.
On Friday, we defined DRAM.
Actually, we didn’t define it, because the acronym never means anything.
The only thing that ever matters is whether you are on the right side of the trend.
On Saturday, we welcomed back Sam Gatlin for a fresh look at a revolution.
Semiconductors just posted the strongest four-week surge in history.
And there’s more upside for AI.
Have a great Sunday.
We’ll see you Monday morning…
Stay sharp,
JC Parets, CMT
Founder, TrendLabs