
Bitcoin just gave us another clue.
Last week, I wrote about how roughly $150 billion in Bitcoin value seemed to appear almost overnight. The headlines had plenty of explanations.
Washington D.C. was talking about friendlier crypto rules. The bond market was reacting to the Treasury. Interest rates were moving.
There were plenty of explanations. But the chart had already told us where to look.
As I explained in Where Did $150 Billion Come From?, Bitcoin had fallen right into an area that has mattered for years.
The old ceiling near $60,000 had turned into a floor. At almost the exact same place, Bitcoin had also retraced 61.8% of its entire move from the 2022 lows to the 2025 highs.
That’s a lot of technical stuff to say something pretty simple: Bitcoin fell to a very important level, and buyers showed up.
Boy, did they show up.
The buying pressure we’ve seen since then has been incredibly resilient.
Historically, this type of momentum thrust is much more consistent with the beginning of a move than the end of one.
That’s important because everyone wants to know whether Bitcoin’s best days are behind us.
I think the evidence is pointing in the other direction.
This Is What Early-Cycle Behavior Looks Like
One of the mistakes investors make is assuming that a big move means they missed it.
Bitcoin jumps, software stocks rip higher, and suddenly everybody starts asking the same question: Is it too late?
But strong markets don’t usually begin quietly.
They announce themselves.
We just saw that in software stocks.
After getting crushed, software stocks fell to the 61.8% retracement of their entire prior advance and then absolutely ripped off the lows.
Bitcoin did almost the exact same thing.
Again, you don’t need to understand Fibonacci math to appreciate what happened.
An asset had a huge advance, suffered a nasty decline, reached an area where buyers had a good reason to show up, and then exploded higher.
That’s information.
More importantly, the kind of buying pressure we’re seeing in Bitcoin is historically something we tend to see earlier in cycles.
This is not the type of behavior that makes me think we’re watching the final few innings.
Quite the opposite.
And if Bitcoin really is beginning another major leg higher, we can use its own history to give us a roadmap for where it might be going.
The Roadmap to $300,000
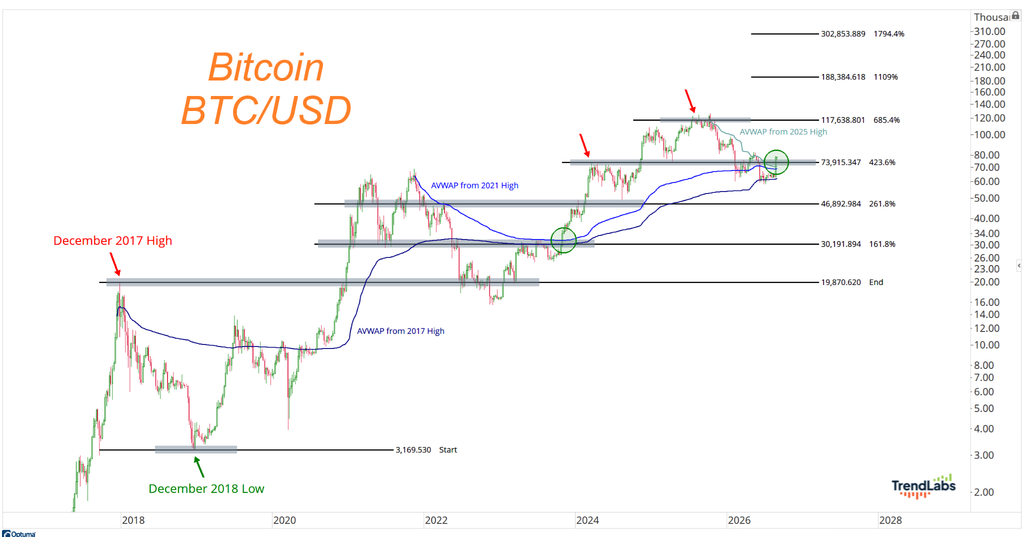
Here’s the chart I can’t stop looking at:
We’re going all the way back to Bitcoin’s peak in 2017 and the major low that followed in late 2018.
Why go back that far?
Because markets have memories. When we take that old Bitcoin cycle and measure the Fibonacci extensions from it, something remarkable happens.
Those levels have continued to matter years later.
One of them took us almost exactly to where Bitcoin peaked last year. The next one points toward the $180,000 area.
After that, we get $300,000:
There’s something else happening on this chart that I really like.
Bitcoin is now above the anchored VWAPs from the 2017 highs, the 2021 highs, and last year’s highs.
We’ve talked about anchored VWAP before. In plain English, it tells us the average price paid since an important point in time.
Right now, the average buyer since each of those three major Bitcoin peaks is sitting on a profit.
That matters to me. We want to hang out with winners, not losers. Investors sitting on gains behave very differently from investors waiting for a rally just so they can finally get their money back.
So now we have an old roadmap that’s already done a pretty good job identifying important levels, while buyers from three of Bitcoin’s biggest previous peaks are sitting on profits.
I like that combination.
Now, let me be clear about what I’m saying here. Fibonacci levels aren’t magic. Bitcoin doesn’t know that I have lines on a chart.
And I certainly don’t know that Bitcoin is going to trade to exactly $300,000 on a particular Tuesday afternoon.
That’s not how this works.
These levels are a roadmap, not a promise.
What gets my attention is how well that roadmap has already worked.
We took a Bitcoin cycle from almost a decade ago, extended those levels forward, and watched them continue to matter years later.
So when the next major extension points toward $300,000, I’m paying attention.
Especially after Bitcoin just held another important Fibonacci level on the downside and responded with the kind of buying pressure we historically associate with the early stages of an advance.
I think Bitcoin is going to at least $300,000 during this cycle.
But having a target isn’t enough. We also need to know what would prove us wrong.
For me, that number is roughly $74,000.
As long as Bitcoin is above that area, I want to continue approaching this from the long side. If Bitcoin gets back below $74,000, then we’ll have to reevaluate the thesis.
And I’m perfectly OK with that.
I don’t claim to know exactly what’s going to happen.
I’ve just gotten pretty good over the years at identifying situations where the potential reward is much greater than the amount of risk we need to take to find out if we’re right.
I think this is one of those situations.
Last week, the question was where that $150 billion came from.
Now I’m much more interested in where Bitcoin is going next.
The roadmap says $180,000.
And after that, $300,000.
Stay sharp,
JC Parets, CMT
Founder, TrendLabs