
If you think the stock market is about to crash because investors have borrowed too much money, you better have another reason.
Too much leverage isn’t it.
That might sound surprising because every few months another scary chart starts making the rounds.
The chart usually comes with some version of, “The last time this happened was right before the Tech Bubble,” or, “This only happened before the Financial Crisis.”
The message is always the same: “Be afraid.”
The problem is that many of these charts compare things that have very little to do with one another.
One of the most popular examples is margin debt divided by GDP. It sounds sophisticated.
It looks important:
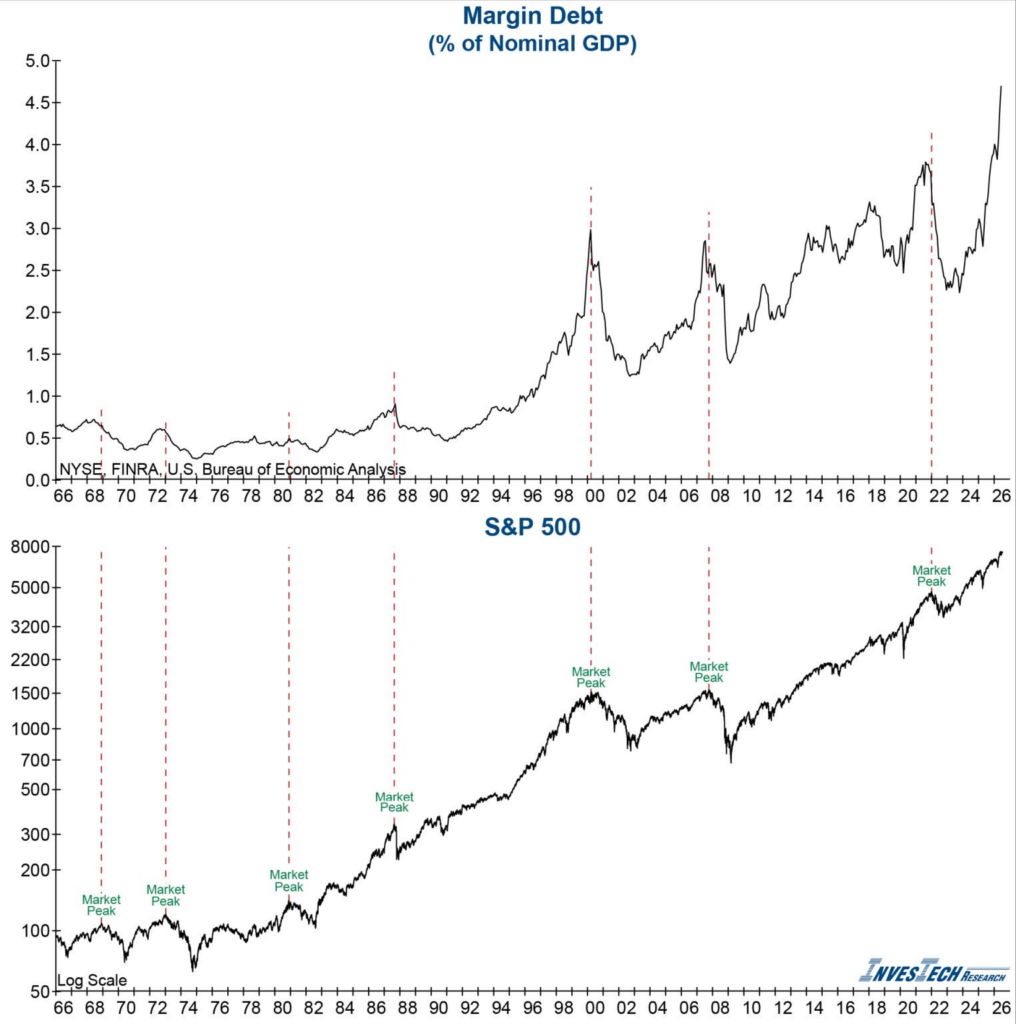
But if you stop and think about it for a minute, it doesn’t make much sense.
GDP measures all the goods and services produced by the U.S. economy.
Margin debt is simply money investors borrow from their brokerage firm to buy more stocks than they could afford with their own cash.
Think of it like taking out a loan to buy a bigger house. Borrowing lets you buy more, but it also means losses can get bigger if prices fall.
That’s why investors pay attention to margin debt in the first place. If too many people borrow too much money, a market decline can snowball as investors are forced to sell.
The problem isn’t looking at margin debt. The problem is comparing it to the wrong thing.
If your goal is to understand whether investors are taking on too much leverage, why compare it to the economy instead of the thing the money is actually buying?
Compare Apples to Apples
Imagine your neighbor tells you your house is way too expensive because it’s worth more than all the corn grown in Iowa.
You’d probably think he was joking.
The value of your house has nothing to do with corn production. If you wanted to know whether your house was expensive, you’d compare it to other houses nearby.
The same idea applies here.
If investors borrow money to buy stocks, compare that borrowing to the value of the stock market. That’s the asset the debt is financing.
When you do that, today’s margin debt doesn’t look anything like the scary headlines suggest. It doesn’t look historically extreme.
It looks remarkably ordinary:
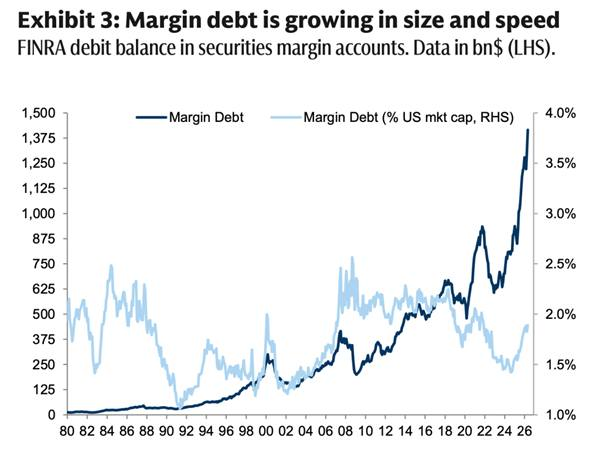
In fact, margin debt was much higher during the 1980s and in 2007. It’s currently nowhere near an all-time high.
In the background, I also hear another argument, “Nobody uses margin anymore. Everyone just buys leveraged ETFs.”
Again, the numbers don’t support it.
All of the leveraged ETFs, leveraged ETNs, and leveraged single-stock ETFs combined hold less than $200 billion in assets. That’s only about 0.25% of the total U.S. stock market.
Yes, there are more leveraged products than there were a few years ago. There are funds tied to Nvidia (NVDA), Tesla (TSLA), Palantir (PLTR), and just about everything else.
But having more products doesn’t mean investors are using dramatically more leverage.
There are more coffee shops in America than there were 20 years ago. That doesn’t mean everyone drinks 10 cups of coffee before breakfast.
More choices don’t automatically change the bigger picture.
Why You Should Care
Scary stories make people do expensive things.
If you believe every headline telling you leverage has reached dangerous extremes, you might sell perfectly good investments for the wrong reason.
That’s a mistake that can cost far more than simply sitting through normal market volatility.
Could stocks go down? Absolutely. Corrections and bear markets are part of investing.
In fact, we recently looked at an Allianz survey showing nearly two-thirds of American adults believe a major recession is around the corner.
That’s already a pretty pessimistic starting point.
If you’re bearish, that’s perfectly fine. Just make sure you’re bearish for the right reasons.
If stock prices are rolling over, if market breadth is deteriorating, if credit markets are flashing warning signs, let’s talk about it. Those are legitimate things to watch.
But simply pointing to margin debt without putting it into context isn’t enough.
The goal isn’t to find the scariest chart on the internet. The goal is to understand what the chart is actually telling you.
Right now, when margin debt is measured against the stock market it’s financing, leverage looks well within its historical range.
Could that change someday? Of course.
But today isn’t that day.
If you think a bear market is around the corner, you may end up being right. Markets don’t move up forever.
Just make sure your conclusion is based on evidence instead of a chart that was designed to scare you.
Stay sharp,
JC Parets, CMT
Founder, TrendLabs