
I was talking markets with a trader friend early Friday morning when he said something that really caught me off guard.
“You know, I rarely look at weekly charts.”
Really?
I found that fascinating because I’m almost the exact opposite. I find myself living in a weekly world.
Which, now that I say it out loud, sounds like an ’80s song. Madonna was living in a material world. Apparently I’m living in a weekly one.
You guys know how much I love my monthly charts. Are you kidding me?
Zooming out is one of the most valuable things we can possibly do as investors. I will die on that hill.
And of course I look at daily charts. I look at them constantly.
But let me explain what I mean by all of this, because it’s actually very simple.
A daily chart takes all the trading that happened during one day and turns it into one bar or candle.
A weekly chart takes the entire week and turns it into one candle.
A monthly chart takes the entire month and turns it into one candle.
Same stock, same price, same market: We’re just standing at different distances from it.
Think about looking at your house on a map. Zoom all the way in and you can see your street. Zoom out and you can see your whole town. Keep going and you can see the entire state.
None of those maps is wrong. They’re just showing you different things.
Charts work the same way.
When we zoom in to a daily chart, we can see what has happened over the last few days and weeks much more clearly.
Zoom out to a weekly chart, and suddenly we can see the last year or two without all those little daily moves getting in the way.
Go all the way out to a monthly chart, and we can see decades of history on one screen.
Then we can zoom right back in.
That ability to move back and forth between time frames is incredibly valuable. The monthly chart can tell us which direction the big road is heading.
The weekly can help us see what’s happening along the way. Then the daily can help us get a closer look when we need it.
For me, the sweet spot is usually somewhere in the middle.
That’s the weekly chart.
What the Weeklies Are Saying
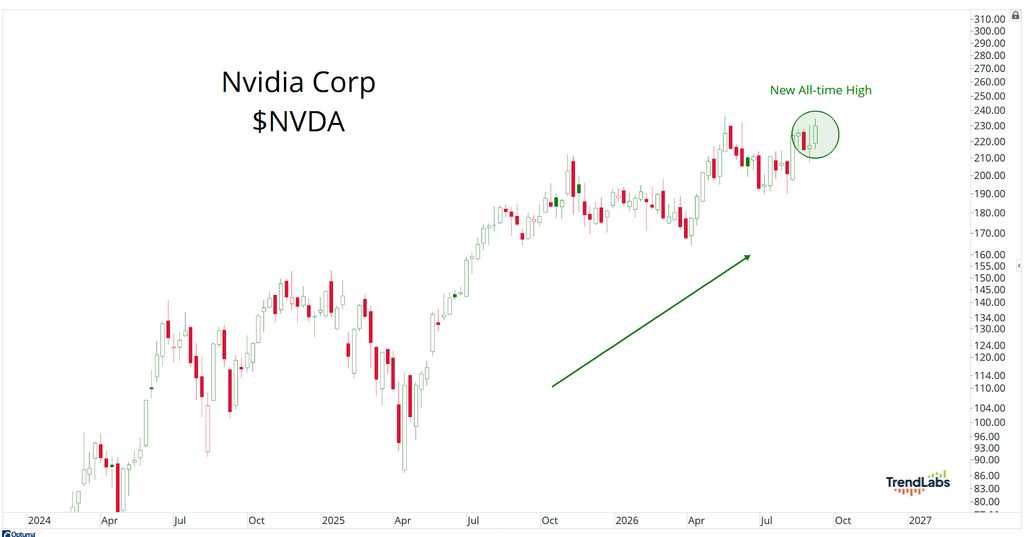
Take Nvidia (NVDA).
It just finished the week at the highest weekly closing price in its history.
That matters to me.
A few years ago, Nvidia started making new highs before a lot of the rest of technology really got going. It was one of the leaders in 2023, and eventually the rest of the group joined the party.
Is Nvidia doing that again?
I don’t know.
That’s why we watch.
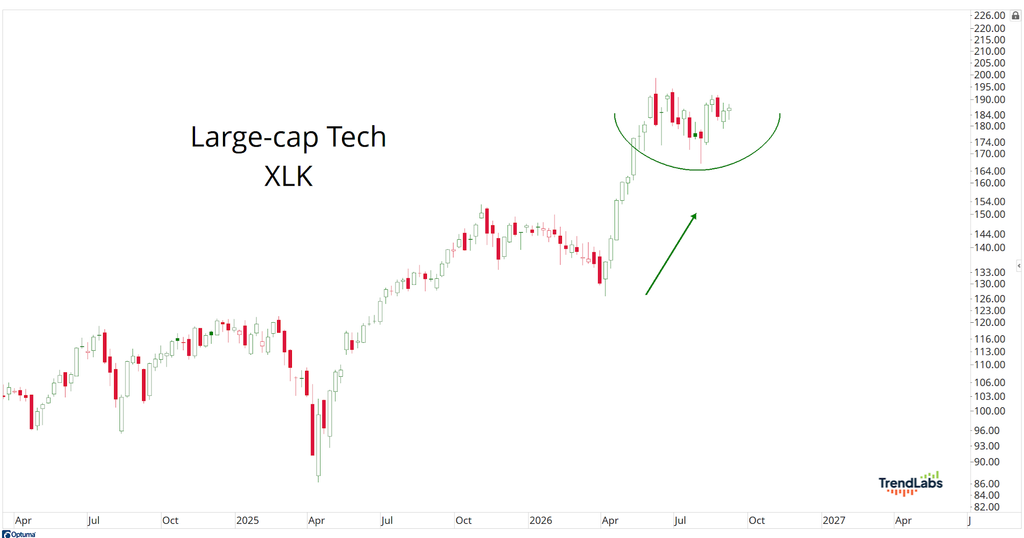
Look at technology more broadly. The tech sector is sitting right near its highs and represents over half the Nasdaq-100:
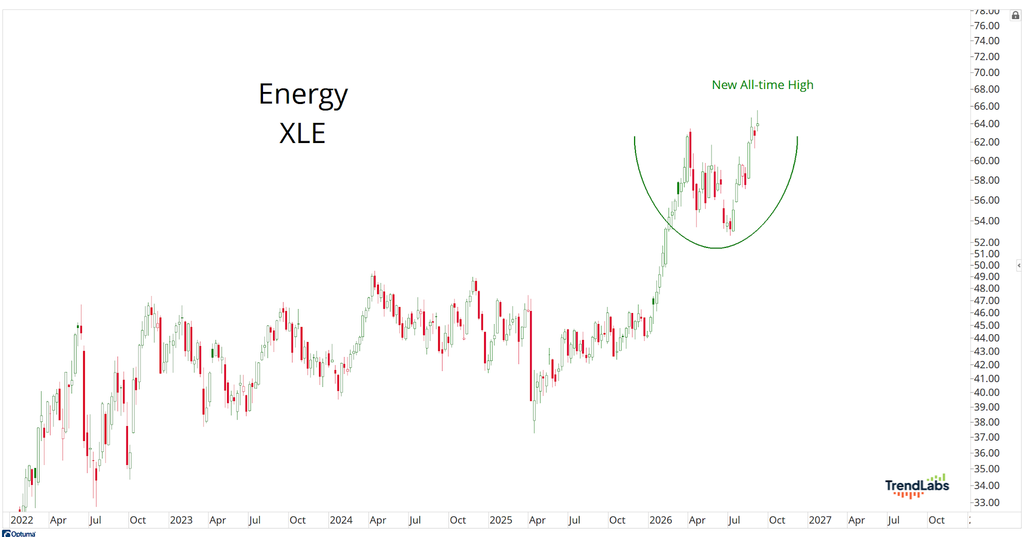
And this isn’t just about technology.
Look at energy. It also just closed the week at the highest levels in history:
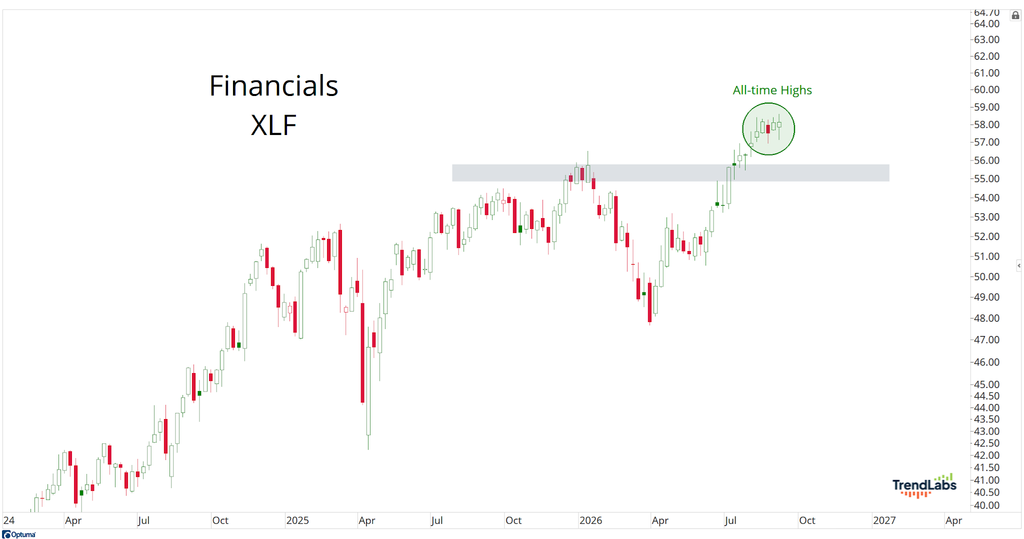
And don’t forget about financials, right near the highest weekly close ever themselves:
These are very different parts of the market telling us similar things.
That’s one of the reasons I like weekly charts so much. They remove a lot of the noise.
Think about what can happen during a normal week.
Stocks can rally Monday, get crushed Tuesday morning, recover Wednesday, sell off again Thursday, and then rip into the close on Friday.
If you were watching every minute of that, it might have felt like five different markets.
The weekly chart takes that entire mess and puts it into one candle.
Now I can see what actually happened that week and compare it with all the weeks that came before it.
That’s powerful.
A move that lasts 10 minutes can reverse pretty easily. Even a big day can disappear the next morning.
But when buyers and sellers battle it out all week and we still finish Friday at the highest prices ever, I pay attention.
That doesn’t mean prices can’t fall next week. Of course they can.
It just means there’s a lot less noise getting in the way of the bigger trend.
Monthly charts take this idea even further. They’re probably the best tool we have for really zooming out and seeing the big picture.
The trade-off is that we only get 12 new monthly candles every year.
Weekly charts give us 52.
That’s a pretty nice middle ground.
We get enough information to recognize when something is changing, but not so much information that every little wiggle starts looking important.
That’s where I like to live.
So Where Should You Live?
I was talking to another trader friend of mine who is much more active. He spends a lot of time looking at 15-minute charts and trading shorter-term moves.
When I told him how much I rely on weekly charts, he laughed.
“Of course you like that better. It’s easier.”
I don’t know if I’d call it easier. Less difficult? Absolutely.
And why wouldn’t I want that?
The goal here isn’t to make investing as difficult as possible. Nobody gives you extra points because you stared at a screen for nine hours and made 37 trades.
The goal is to make money while living the life you actually want to live.
That’s why I think the first question should come before you ever choose a chart:
What are you actually trying to do?
If I wanted to sit in front of a computer all day watching every tick, I’d day trade. I’ve done more of that at other points in my life.
There’s nothing wrong with it. If you enjoy it and have the time for it, then five-minute and 15-minute charts might be exactly where you should live.
I just don’t want to live that way today.
I’m still in tune with markets all day, every day. This is what I do for a living.
I look at prices throughout the day, and I have alerts set up to tell me when something important happens.
But I don’t need to stare at every tick.
I’m generally trying to capture moves that happen over weeks and months. So it makes sense that weekly charts carry the most weight in my process.
Maybe your situation is completely different. Maybe you have a job, kids, hobbies and a million other things going on.
You don’t want to check stocks every few hours, and you certainly don’t want your phone buzzing every time the S&P 500 moves half a percent.
Then zoom out.
Maybe monthly charts are your world.
You can look at the big trends, make fewer decisions and let the market do the work.
That’s really the point here. There is no correct time frame.
There is only the time frame that makes sense for what you’re trying to accomplish.
Start with your life. How much time do you actually want to spend watching markets? How often do you want to make decisions?
Are you trying to capture a move that lasts 20 minutes, three weeks or three years?
Figure that out first. Then work backward.
And regardless of where you decide to live, get comfortable zooming out and zooming back in. Sometimes you need to see the street. Sometimes you need to see the whole state.
The trick is knowing when you need each one.
For me, the answer is pretty clear.
I find myself living in a weekly world.
It moves fast enough to make money, but slow enough to still have a life.
That’s a trade I’ll take every time.
This Week in Everybody’s Wrong
On Monday, we made a basic observation.
If stocks and bonds are responding to the same risk at the same time, you’re not as diversified as you think you are.
Ask not whether bonds are good or bad, ask whether they’re doing the job you hired them to do.
On Tuesday, we asked another simple question.
Is Nvidia (NVDA) a bank now, too, and what do its recent moves mean for the market?
Bottom line, if there’s a monster under the bed, price will tell us before anybody sees it.
On Wednesday, we talked about interest rates rising around the world.
This is not about Donald Trump, or Scott Bessent, or Kevin Warsh.
What does the bond market know that’s making money more expensive right now?
On Thursday, we made the point that numbers don’t have to be faked to mislead you.
That’s what makes Wall Street’s favorite trick so good.
Here’s why “who’s holding the calculator?” is the best question you probably never ask.
On Friday, we talked about new infrastructure for the financial system of the future.
Already, markets don’t need buildings anymore.
Pretty soon, they won’t need clocks, either.
On Saturday, Jason Perz shared another in his compelling series of weekend reads.
Jason’s taking a TrendLabs hiatus to focus his attention on a couple of critical personal projects.
Here’s more reason why he’ll always be a big part of what we do around here.
Have a great Sunday.
We’ll see you Monday morning…
Stay sharp,
JC Parets, CMT
Founder, TrendLabs